Social Analytics enables you to monitor your social media performance across multiple platforms from a single dashboard.
This means you can compare your impact on Facebook, Instagram, LinkedIn, and TikTok at a single glance.
It’s part of the Semrush Social Toolkit—an AI-powered solution designed to streamline and automate your social media marketing efforts.
How Can Social Analytics Help Me?
Social Analytics is a powerful tool for guiding your social media strategy and driving better results.
It gives you a clear view of how your social media efforts—both organic and paid—are paying off. You can track and measure key engagement and audience metrics over time, including impressions, reach, follower growth, likes, and engagement rate.
In addition to viewing your combined performance across all platforms, Social Analytics also lets you break it down by individual channel, so you can drill down into what's working and what's not.
How to Use the Social Analytics Tool
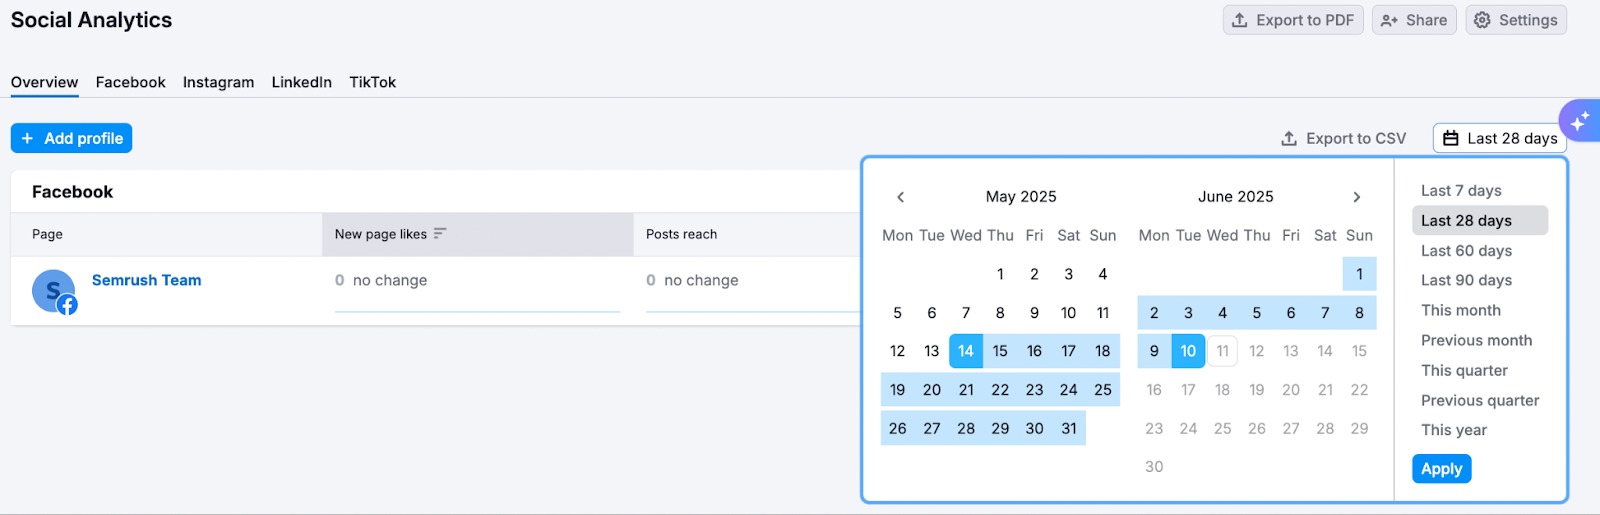
When you open Social Analytics, you’ll land on the Overview tab. This is a high-level snapshot of your performance across all your linked social profiles.
The Overview shows platform-specific metrics grouped by channel.
Like this:

Color-coded percentages let you see at a glance if changes are positive or negative.
You can use the date range selector at the top to filter metrics by a specific period.
To monitor your performance on individual channels, just select a platform from the top panel.
Each platform has its own dedicated reports with the following metrics:
- Facebook: Page Likes, Engagement, and Posts
- Instagram: Audience, Profile Interactions, Stories, and Posts
- LinkedIn: Audience, Engagement, and Posts
- TikTok: Engagement and Posts
This setup makes it easy to track what’s working and what’s not, monitor performance growth or decline, and tweak your social media marketing strategy for better results.
Here’s how to use it for each platform.
Analyze Facebook Performance
Select Facebook from the top panel.
You’ll see your Facebook analytics and three reports:
- Page Likes
- Engagement
- Posts.

Page Likes
This report shows the distribution of your Facebook Page likes over the selected period.
You’ll see:
- Total Page Likes
- New Page Likes
- A comparison of Organic and Paid Likes

The trend graph shows how your likes and unlikes (followers) have changed daily, helping you understand your page followers’ performance.

If you don’t see any data, try adjusting the date range or checking that your Facebook page is properly connected.
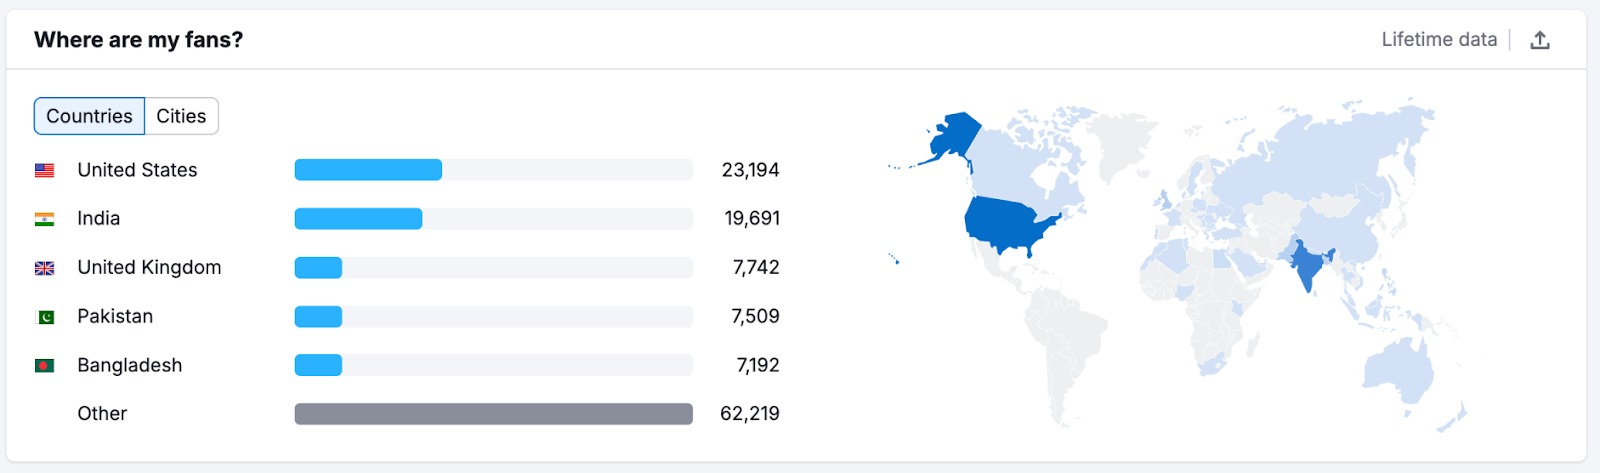
You can see where your followers are based in the "Where are my fans?" section.
Engagement
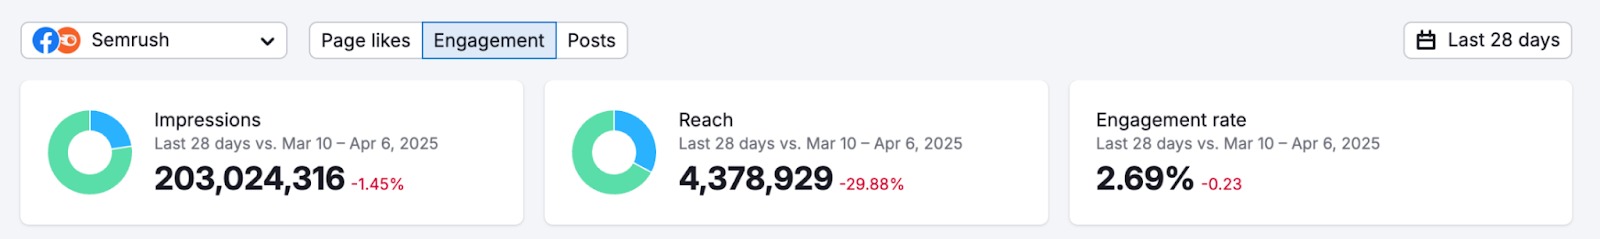
The Engagement report shows how your Facebook content is performing in terms of visibility and user interaction.
At the top, you’ll see three widgets showing:
- Impressions: How many times your posts have been displayed
- Reach: How many unique users have seen your posts
- Engagement Rate: How often people have interacted with your content (likes, shares, comments) compared to how many saw it
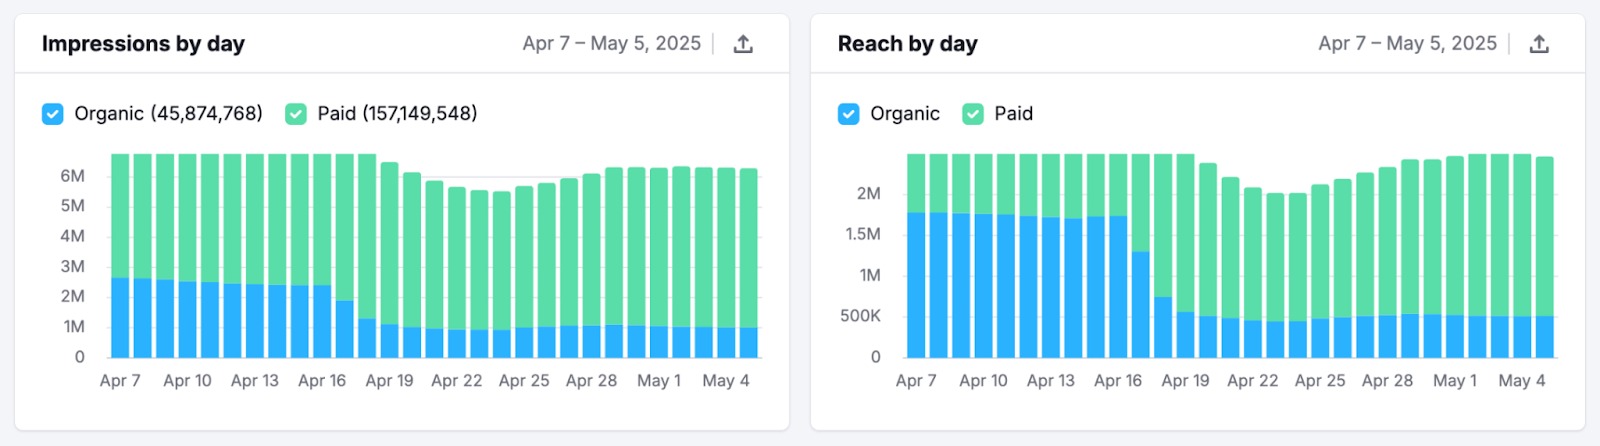
Just below these widgets, two bar graphs break down your impressions and reach by day. They can be filtered to show organic and paid sources.
The Engagement by Days graph lets you see how your engagement rate, total engagement, and all reactions have changed over time. You can select them one by one from the drop-down.

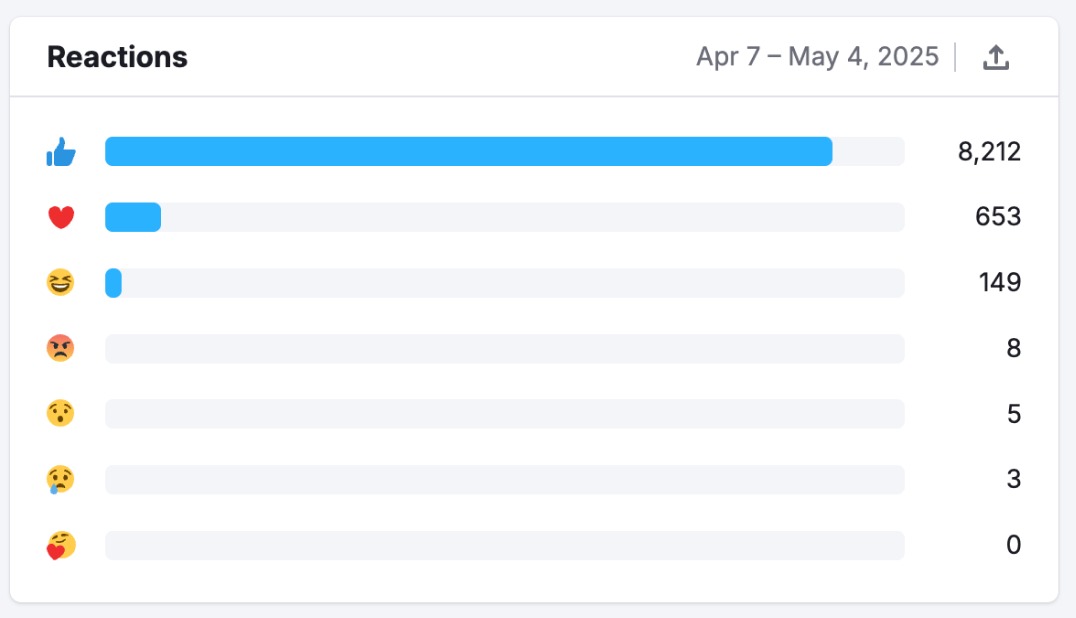
Finally, at the bottom of the dashboard, you’ll find a breakdown of the reactions your content has gotten, by emoji.
Posts
The Posts report helps you understand what kind of content resonates with your audience and drives the most engagement.
You’ll find three sections:
- Top posts: Highlights your top-performing posts. You can filter by engagement rate, link clicks, and total reactions
- Post types: A visual breakdown of the reactions generated by your top-performing posts
- Published posts: Detailed metrics for your top posts, including engagement rate, link clicks, video views, reactions, and so on.

Top posts are determined by the following criteria:
- Engagement Rate ≥ 2%
- Number of people click on links ≥ 3
- Number of people engaging with the post ≥ 3
- Number of people reacting to the post ≥ 5
Note: Social Analytics doesn’t show data for ads created via Facebook Ad Manager.
Analyze Instagram Performance
To review Instagram analytics, select Instagram from the top panel.
You’ll see four reports:
- Audience
- Profile Interactions
- Stories
- Posts

Each section helps you understand how your followers engage with your content and which formats drive the best results.
Audience
In the Audience report, you can see visual breakdowns by:
- Country
- Gender
- Age group
- Most active times
Each of these metrics has its own widget.
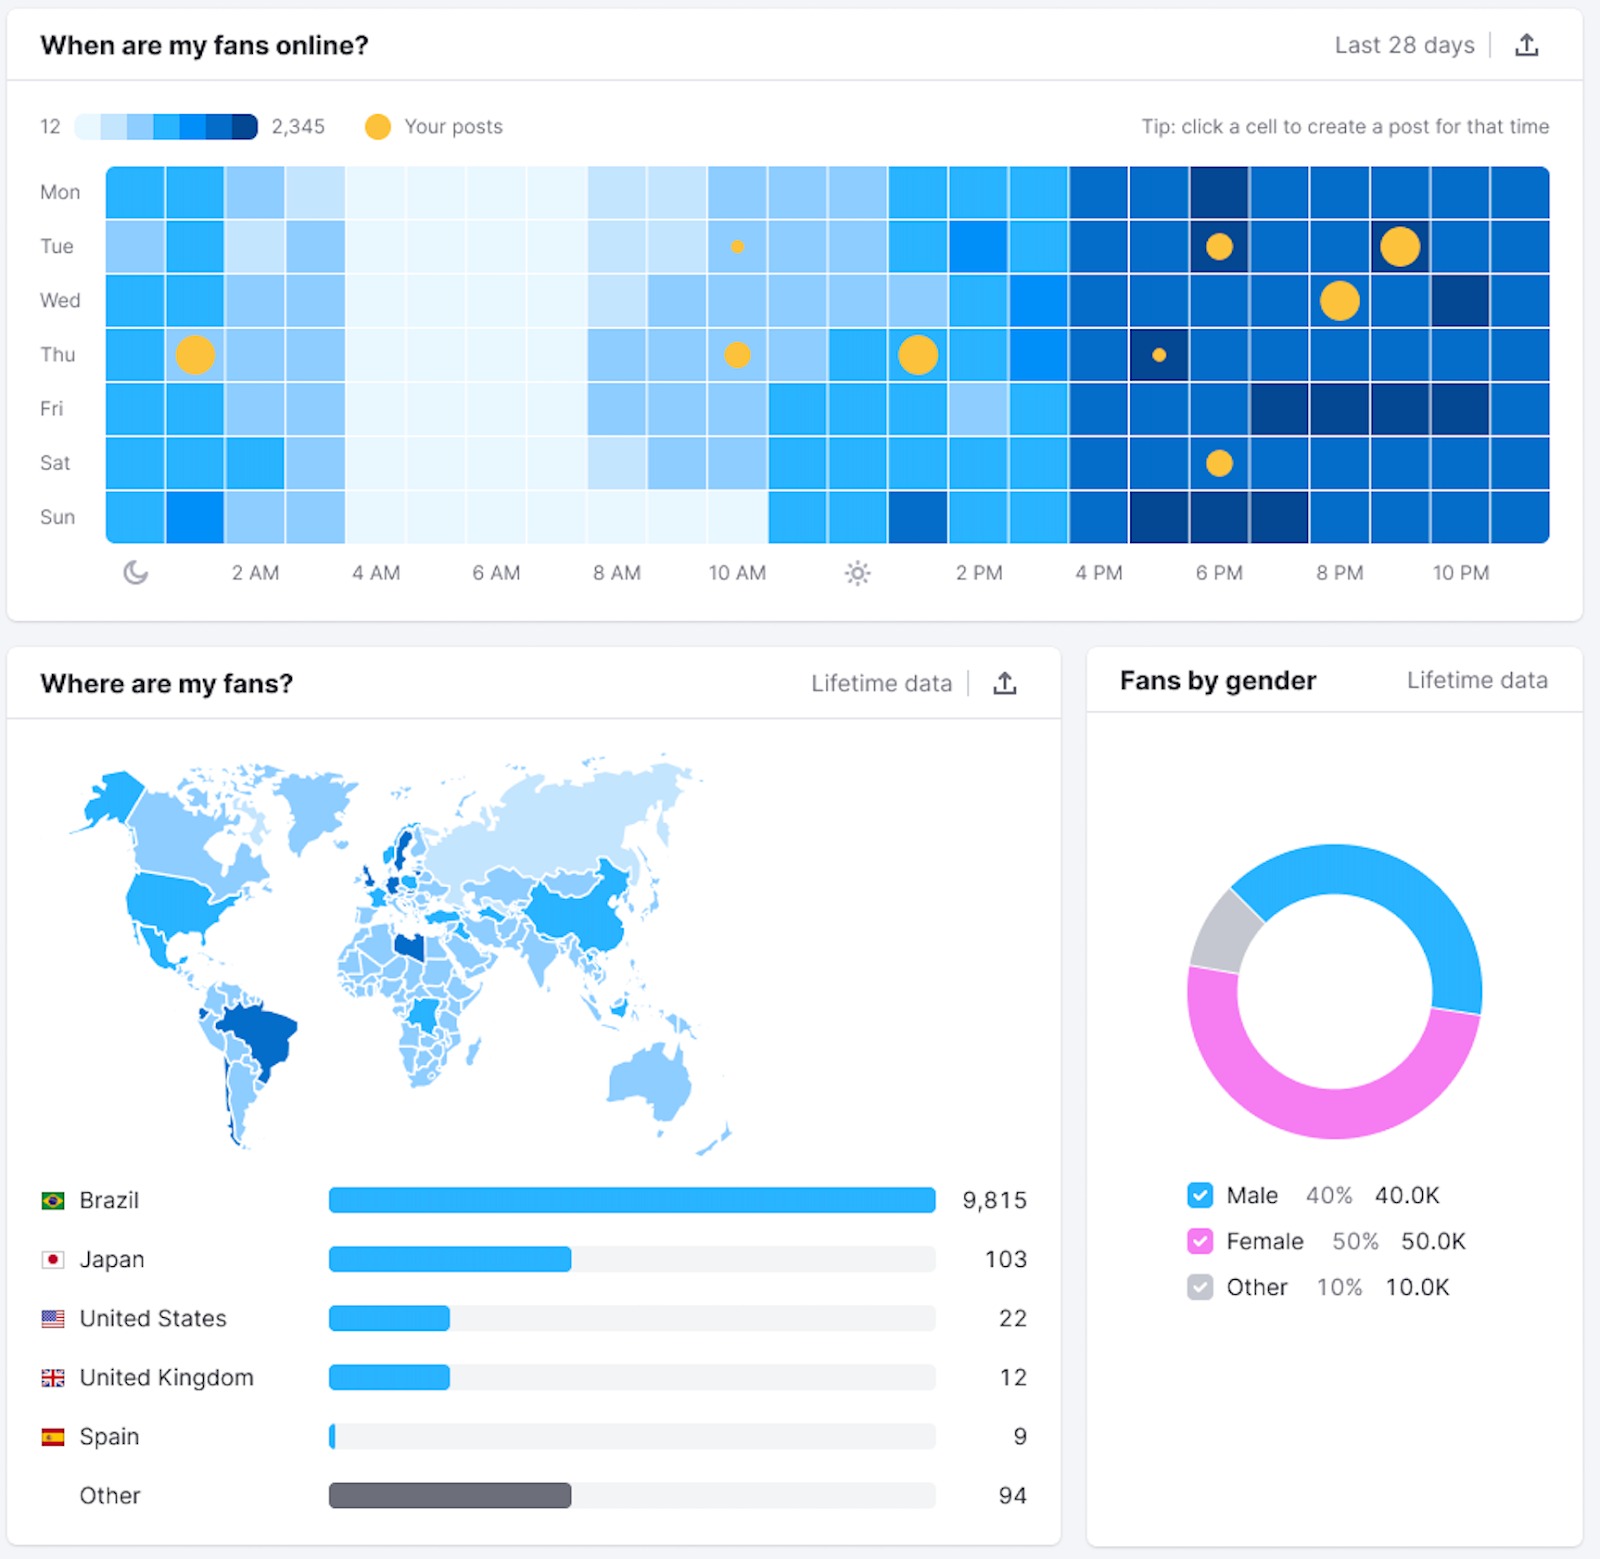
Use these insights to tailor your content and posting schedules for maximum reach and relevance.
Profile Interactions
The Profile Interactions report shows how users engage with your profile beyond content interactions. It shows:
- Profile views
- Website link taps
- Phone call taps
- Text message taps
- Direction taps
- Email taps
This section helps you measure how effectively your profile drives real-world actions such as visits, calls, or clicks.
Stories
The Stories report highlights the Instagram stories that are driving the most engagement.

You’ll see two spotlight widgets:
- Most Engaging: Stories that have triggered the most replies
- Most Catching: Stories that users have watched more than once
Underneath the widgets, you’ll find two tables showing active and archived stories, with performance metrics for each:
- Impressions: The number of times the story has been seen
- Reach: The number of unique viewers
- Replies: How often viewers responded to a story
- Reply rate: The ratio of views to replies received
- Taps back: The total number of times all users have tapped back to the previous story. This suggests that users wanted more context or needed more time to take in the content.
- Taps forward: The total number of times users have tapped forward to the following story—indicating they may have absorbed the content before the end of the story, or that it didn’t grab them.
- Exits: The number of users who quit your set of stories.
With this data, you can learn which story formats are best at holding your audience’s attention and encouraging interaction.
Posts
The Posts report gives you a detailed view of how your Instagram posts are performing.
By default, your posts are sorted by the newest first, but you can filter them to show photos, videos, carousels, or reels. You can also search for specific posts.
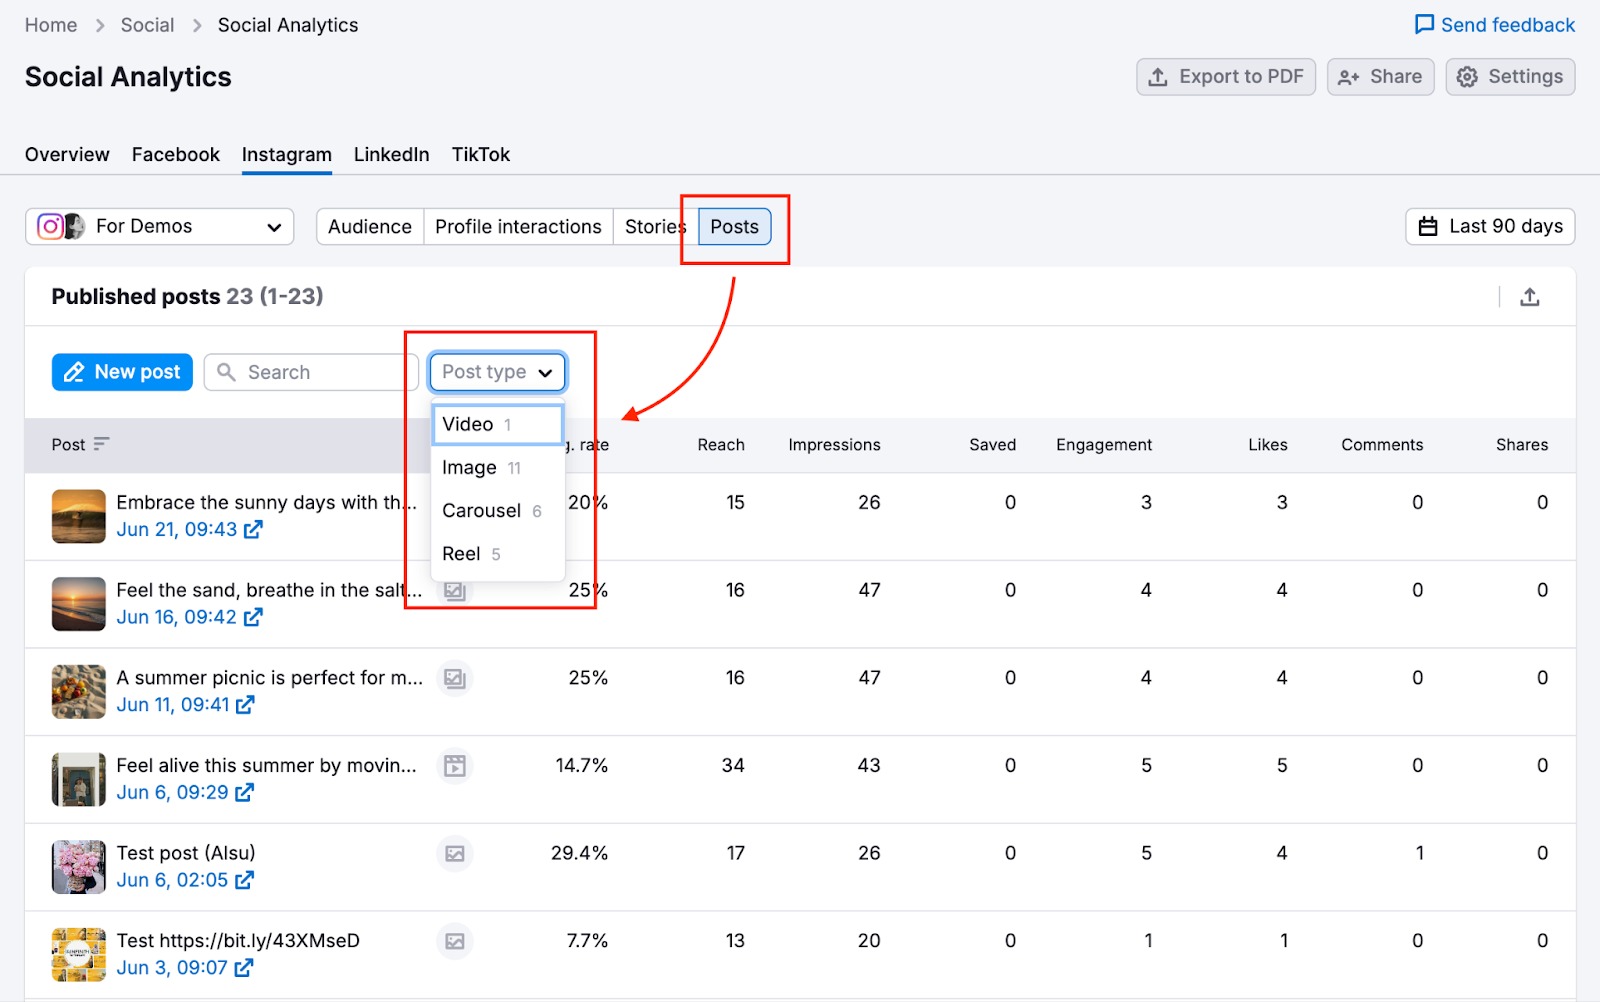
Each post includes metrics such as engagement rate, reach, impressions, saved posts, likes, comments, and video views.
This report will help you understand how different Instagram post types resonate with your audience.
Analyze LinkedIn Performance
Select LinkedIn from the top panel to analyze your performance on LinkedIn.
The LinkedIn tab includes three reports:
- Audience
- Engagement
- Posts

These reports help you explore your follower base, track how users engage with your content, and evaluate which posts drive the most interactions.
Audience
The Audience report gives you a breakdown of who is following your LinkedIn Page.
Your follower insights are broken down by:
- Country
- Company size
- Industry
- Job function
This information lets you get familiar with your audience and tailor content to their roles and interests.
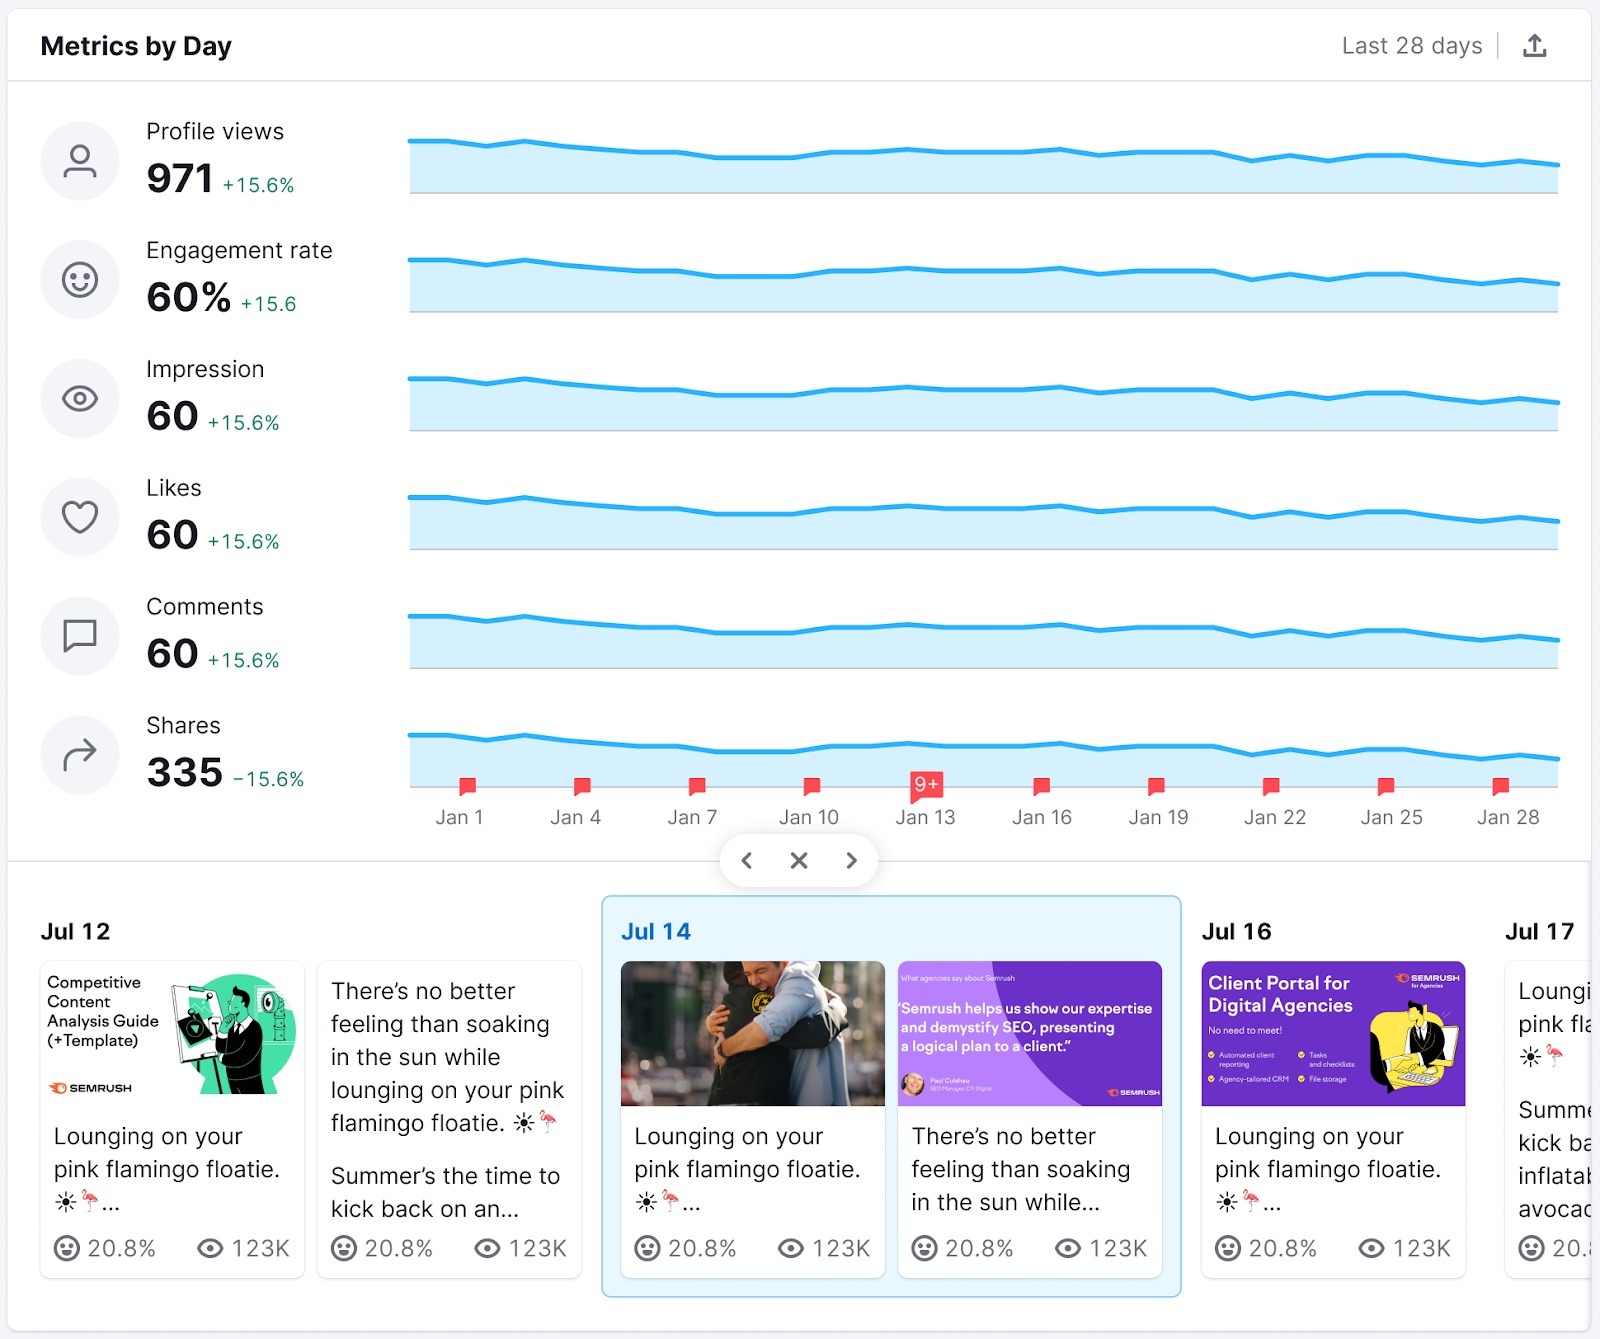
Engagement
The Engagement report shows how people interact with your content over time.
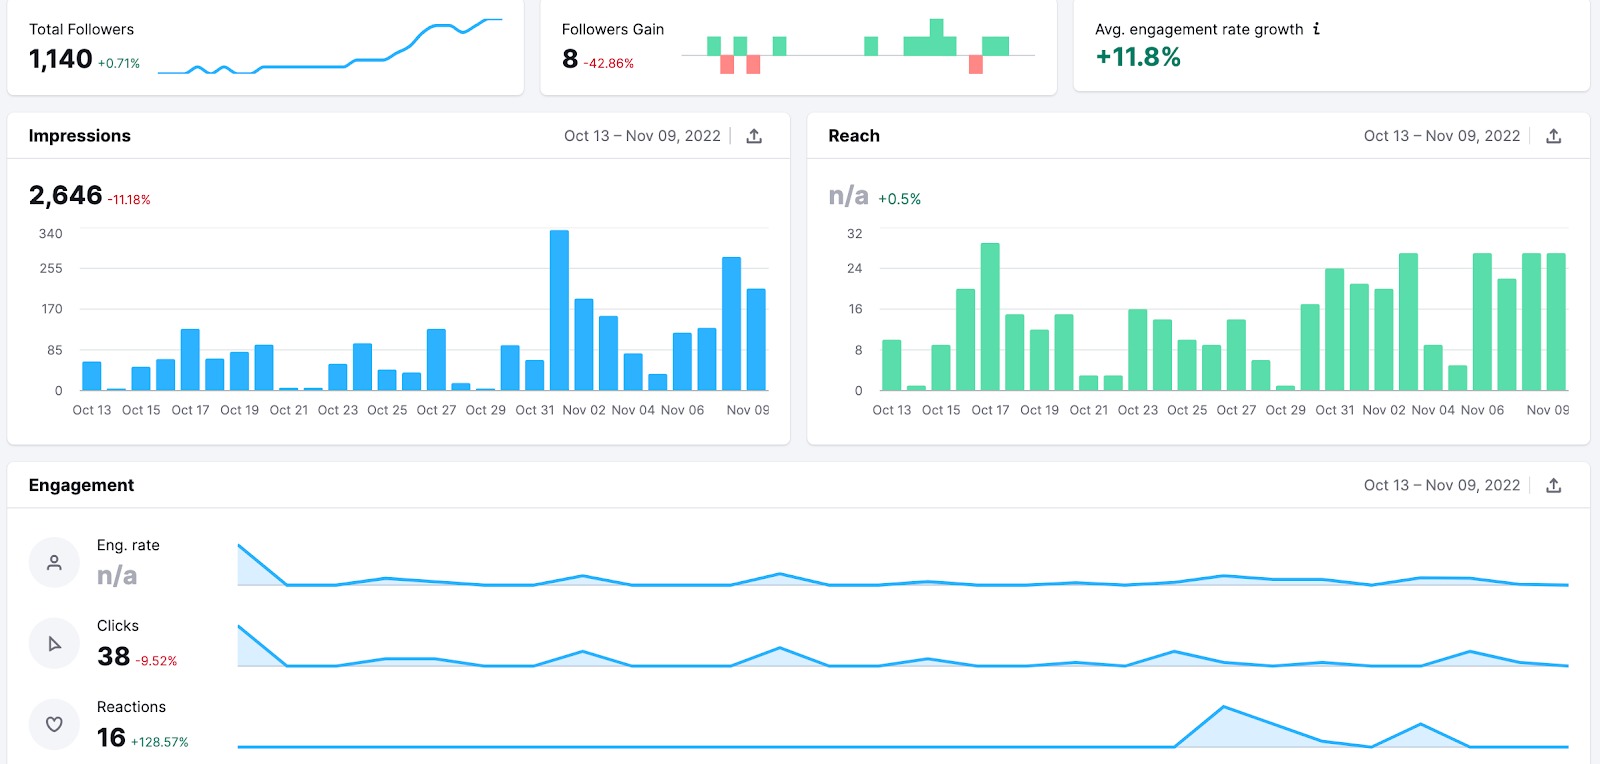
You can track:
- Total followers
- Follower gain: The number of new followers since the previous period
- Impressions: A visualization of how often your posts have been shown
- Reach: A visual breakdown of the unique users who have viewed your posts
- Engagement: A chart showing engagement rate, clicks, and reactions over time
- Engagement rate: The proportion of these viewers who have interacted with your content
Note: Due to LinkedIn API limitations, total reach and total engagement rate are not available.
Posts
The Posts report helps you evaluate how your individual posts are performing on LinkedIn.
For each published post, you’ll see the following metrics:
- Engagement rate
- Likes
- Shares
- Comments
- Clicks
- Impressions
This data shows you which topics, formats, and styles are most engaging for your audience.
Analyze TikTok Performance
Select TikTok from the top panel to analyze your performance on the video platform.
The TikTok tab includes two reports:
- Engagement
- Posts
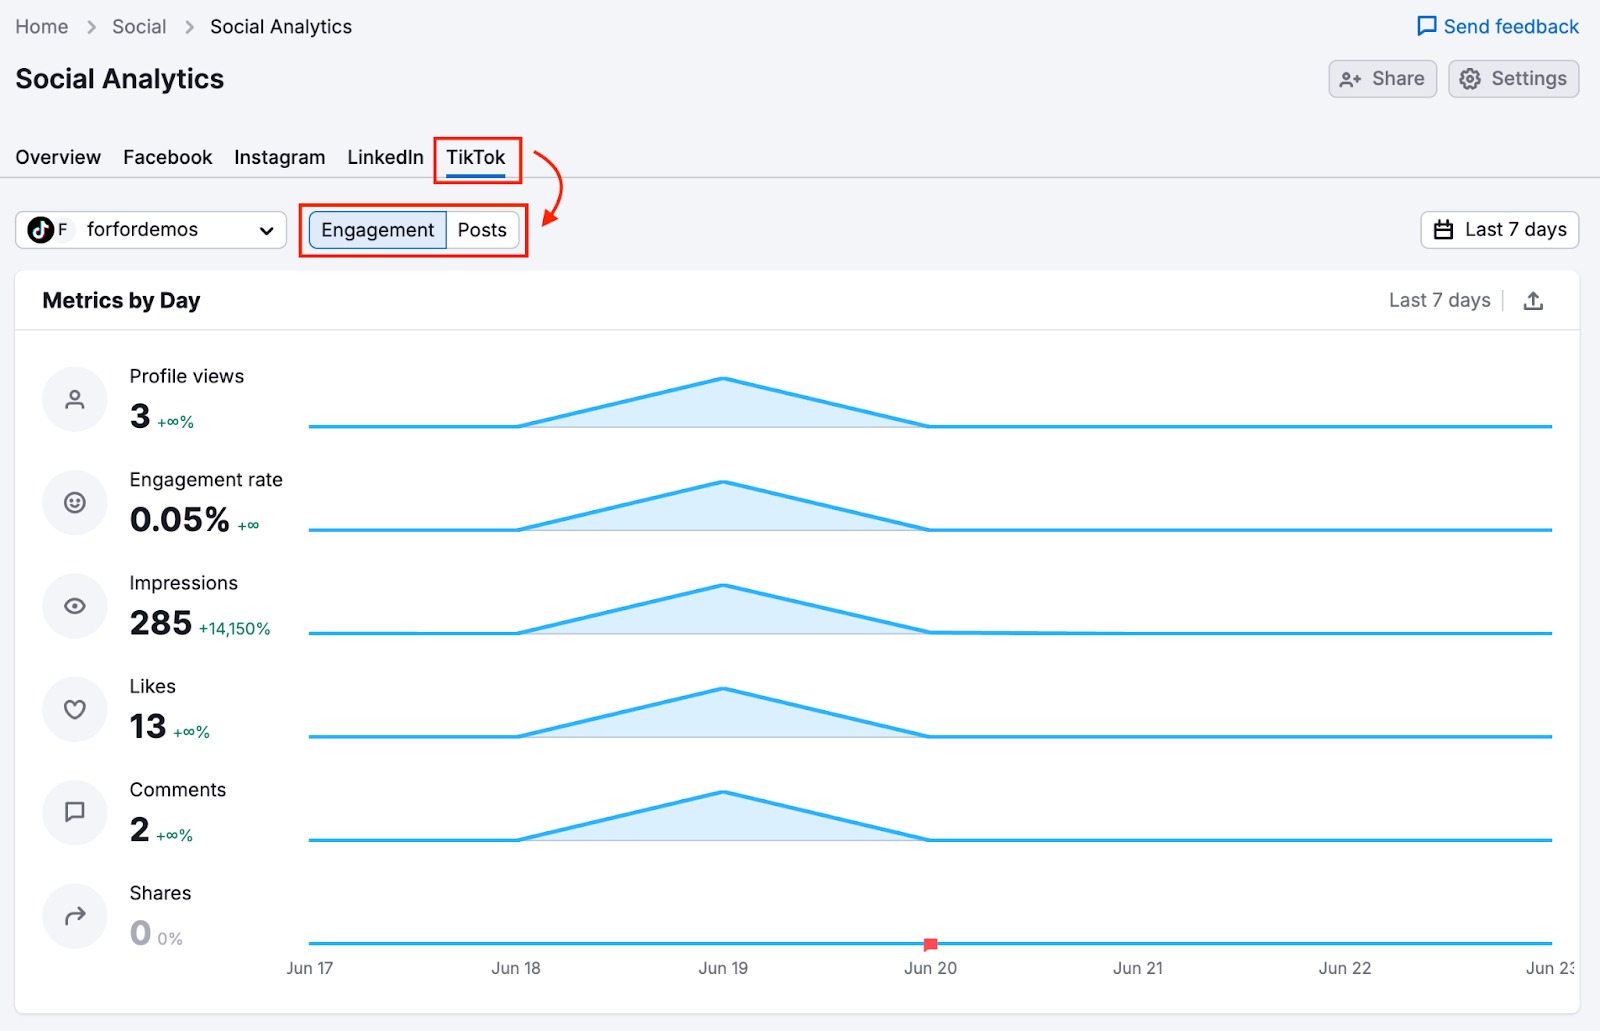
Engagement
The Engagement report enables you to visualize how users are interacting with your TikTok profile.
You’ll see the following metrics:
- Profile views: How often users visit your profile
- Engagement rate: Interactions compared to reach
- Impressions: Total views across your videos
- Likes, Comments, and Shares: A breakdown of all user interactions
This report will make it easy to track audience activity and monitor how your content performs over time.
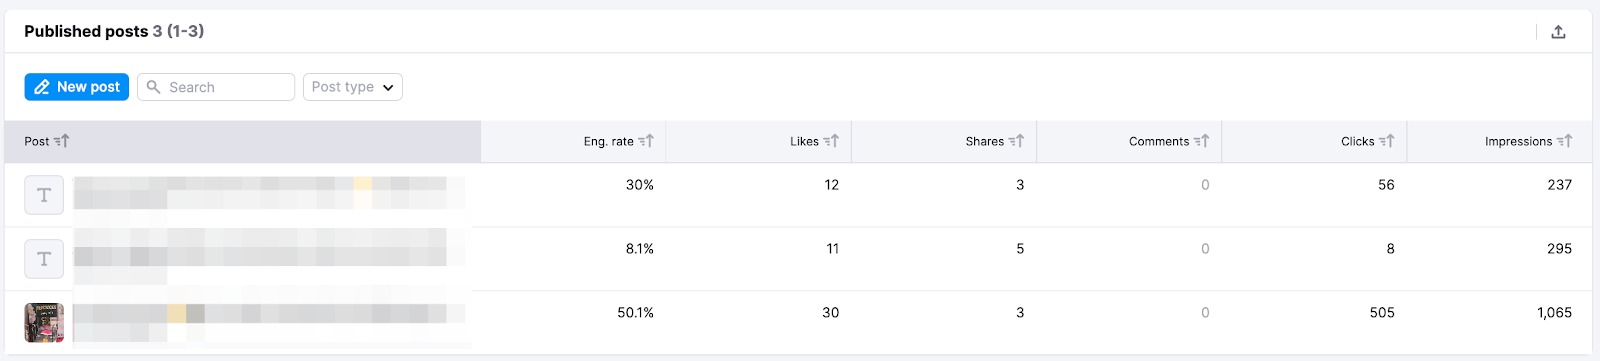
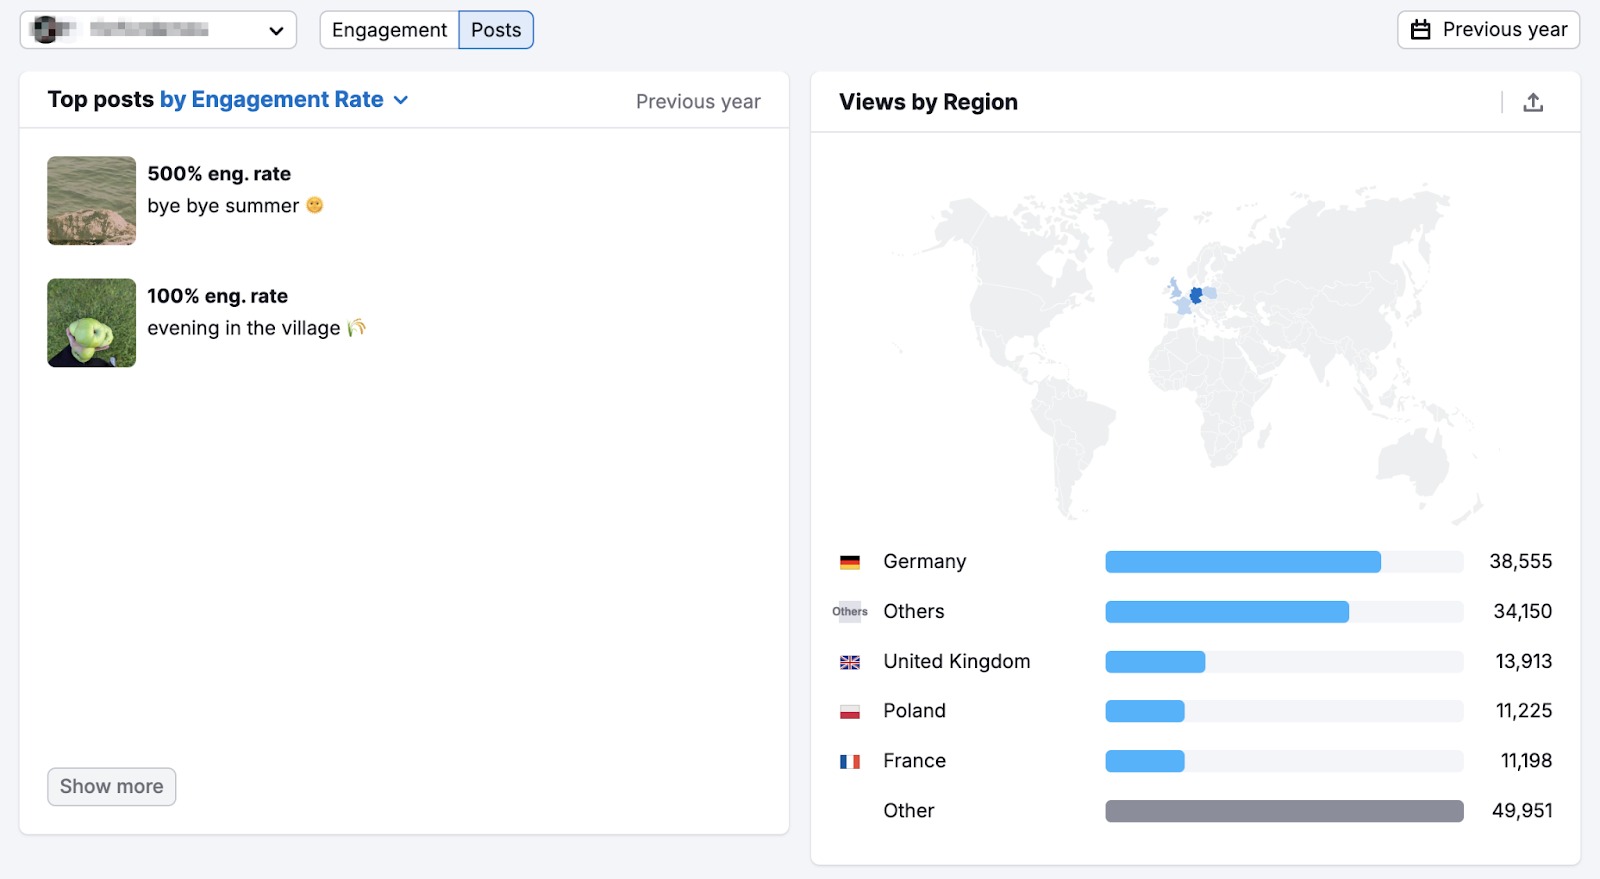
Posts
The Posts report lets you assess the performance of your published TikTok videos.
The three widgets at the top show Top posts, Views by Region, and Published posts. You can filter your top posts by engagement rate and by likes.
Underneath, the Published Posts table details the performance metrics for each video:
- Engagement, including engagement rate, likes, shares, and comments
- Impressions, showing where views are coming from
- Watch rate, plus video duration, total watch time, number of views, full video rate, and average watch time per view
- Audience, which tells you where your videos are receiving the most views from

This will give you the data you need to know what’s working, what’s gaining attention, and how to improve your future TikTok content.
What's Next?
Semrush’s Social Analytics lets you track your content’s performance across Facebook, Instagram, LinkedIn, and TikTok—all from the one platform.
Use Social Analytics to:
- Identify top-performing content
- Understand your audience better
- Improve your posting strategy across platforms
- Spot growth trends
For best results, pair Social Analytics with other tools in the Semrush Social Toolkit:
- Social Poster: Plan and schedule posts based on what’s performing well
- Social Content AI: Generate on-brand content ideas, powered by your analytics
- Social Tracker: Monitor competitors and benchmark your performance
Together, these tools help you streamline your social workflow and make smarter content decisions every week.