The SEO Dashboard is a small-scale analytics report that provides quick insights into what’s currently going on with your site.
The dashboard comprises a set of widgets that display report excerpts from the most valuable and widely used Semrush SEO tools.
How Does it Work?
Monitoring your website on an ongoing basis is grunt work. Using the SEO Dashboard is an easy way to break the routine.
An SEO Dashboard can be generated in a matter of seconds—all you need to do is create an SEO Project. Choose one of your ongoing projects from the list or set up a new one.
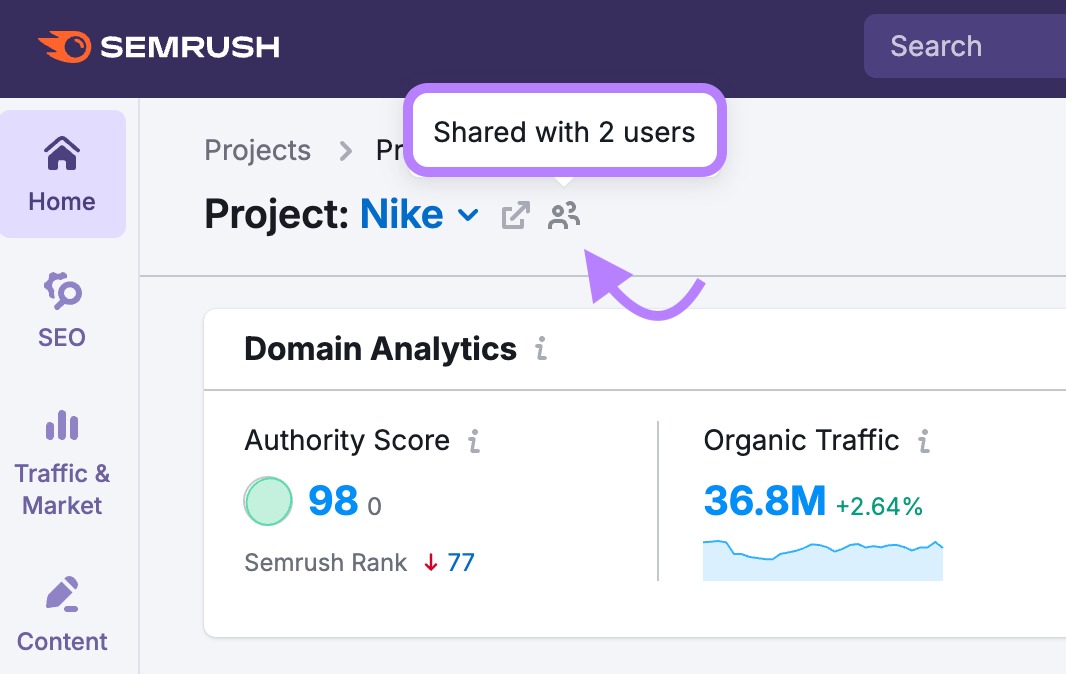
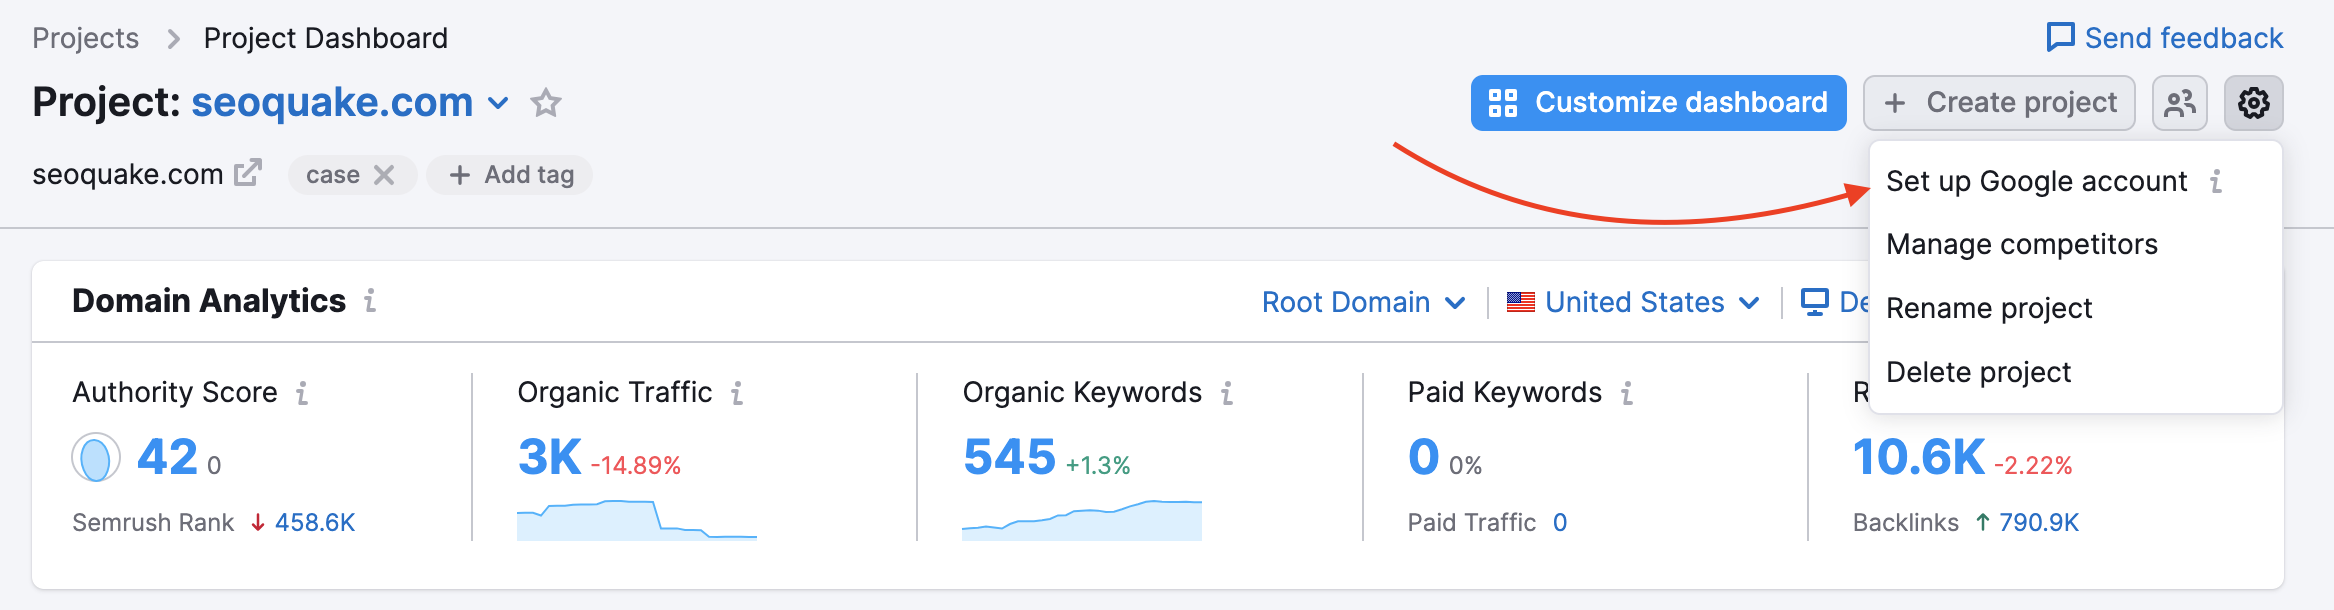
You can go straight to your project’s website by clicking the arrow button next to the project title, and you can also check how many people the project is shared with.
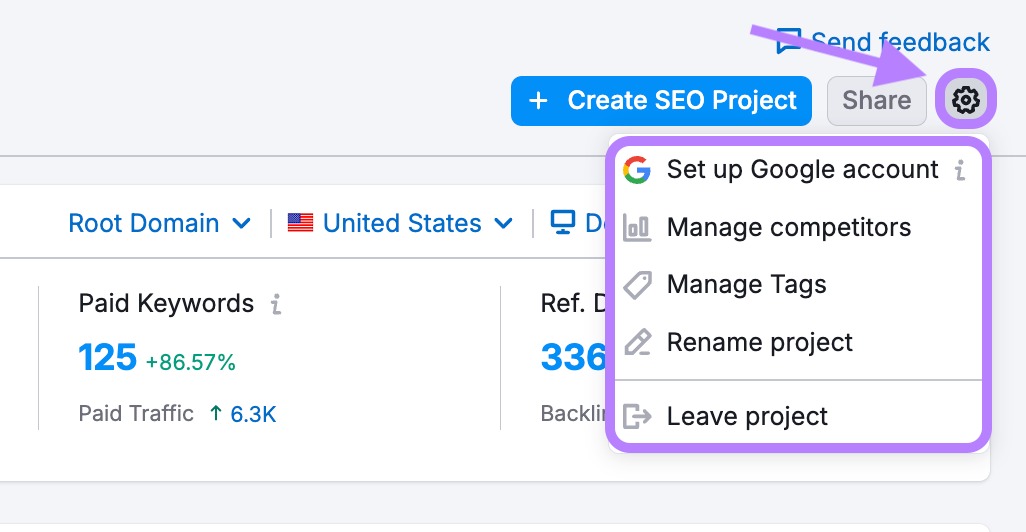
Furthermore, you can open the settings menu to set up a Google account, manage competitors and tags, rename, and delete projects.
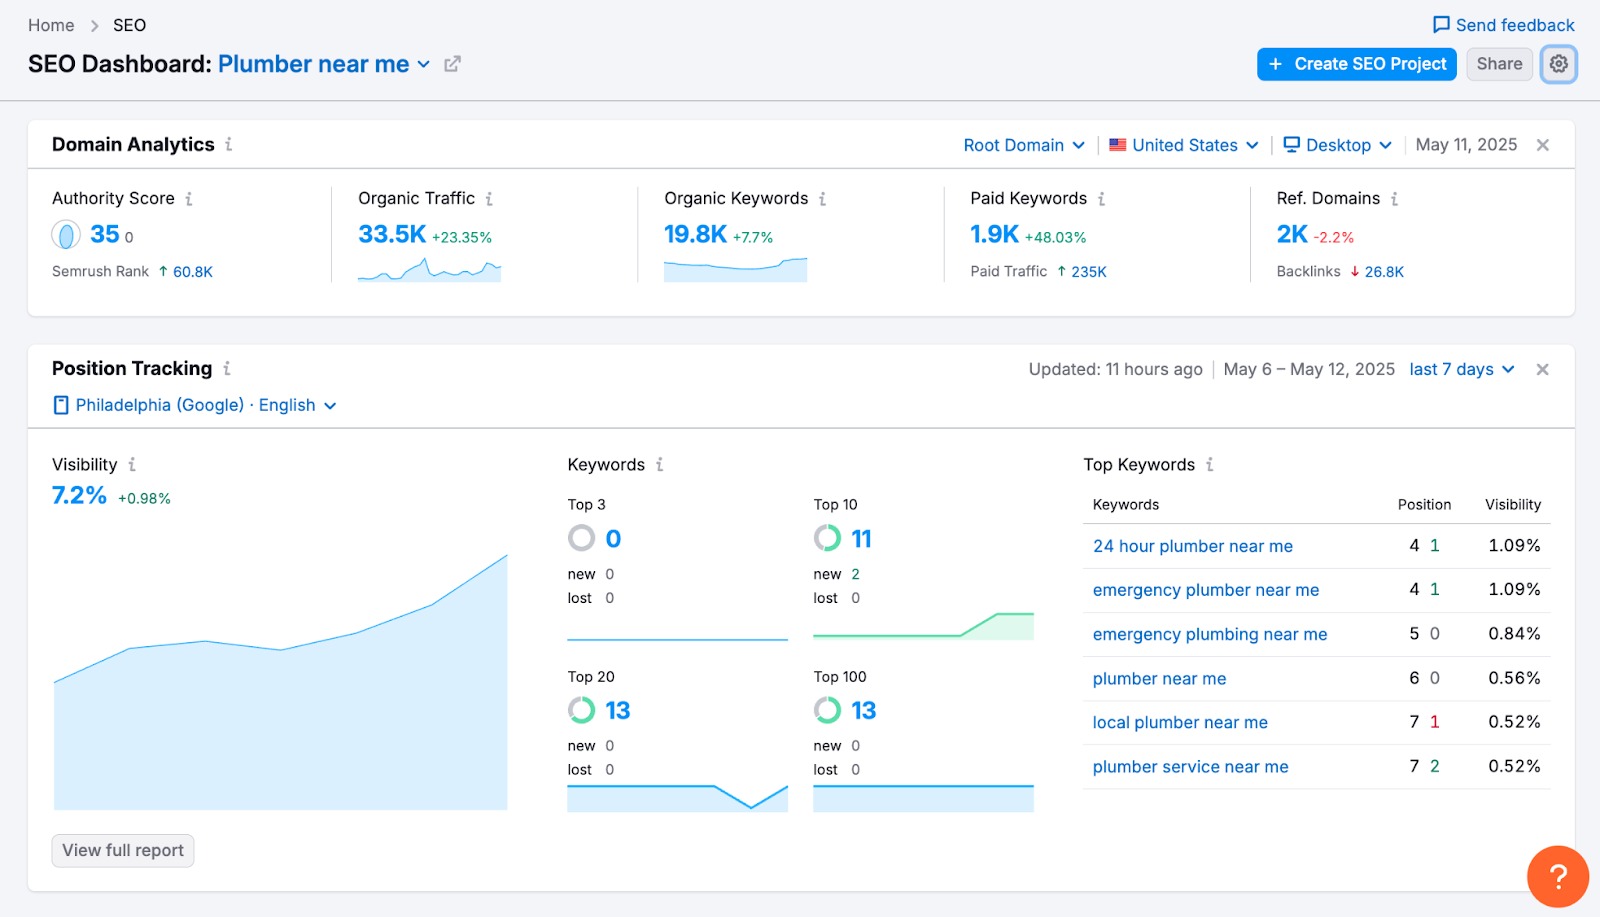
You’ll see all available data for the selected project as you are directed to the dashboard.
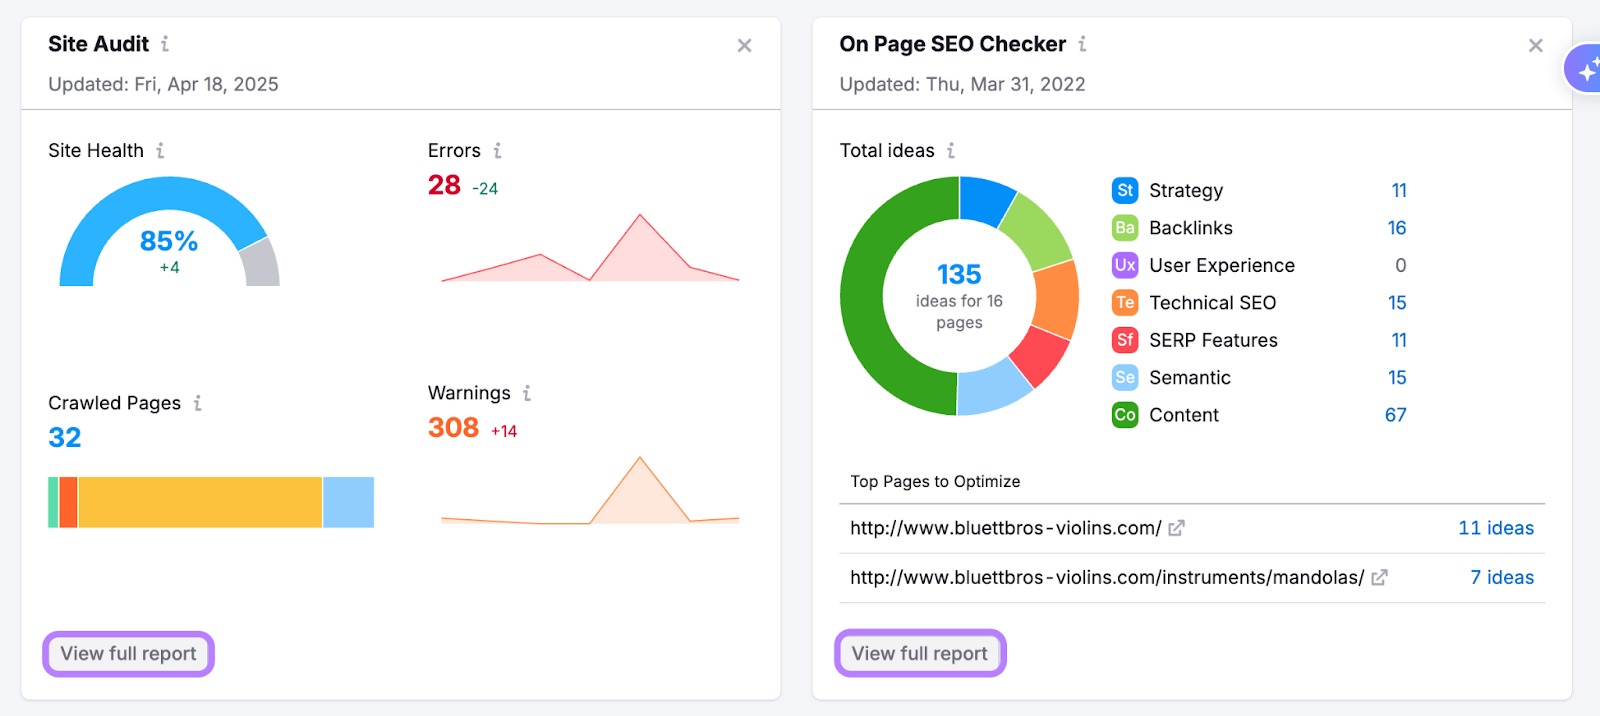
The data in each widget originates from a tool or report in the Semrush SEO toolkit. If you want more detail, press the ‘View Full Report’ button at the bottom of a widget. You’ll then be redirected to the corresponding tool or report.
Remember that the data in each widget of the SEO Dashboard is refreshed with a different frequency. This will depend on how often the data is refreshed in the original tool.
SEO Dashboard Widgets
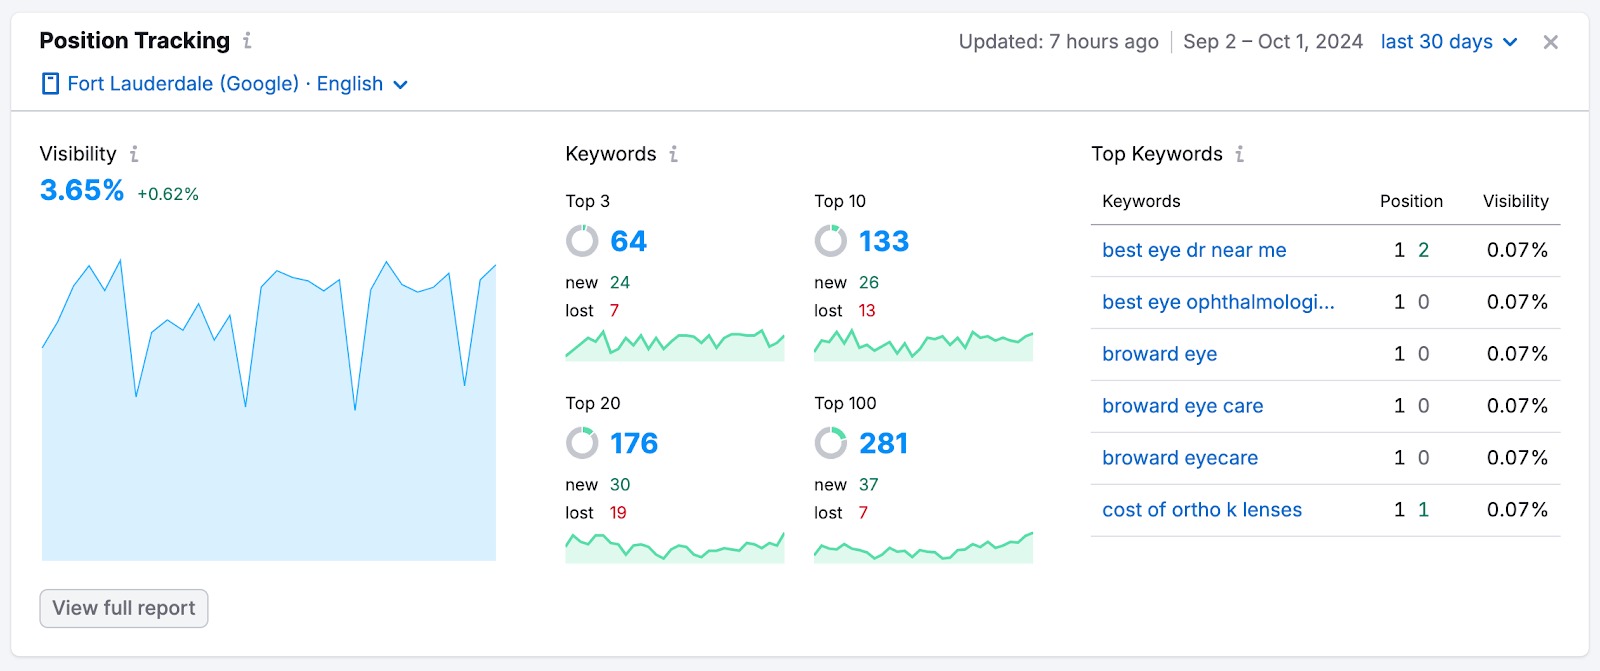
When you create a campaign in one of the Website Monitoring tools in the SEO Toolkit (such as Position Tracking or Site Audit), Semrush adds a preview widget to your dashboard to help you monitor your progress.
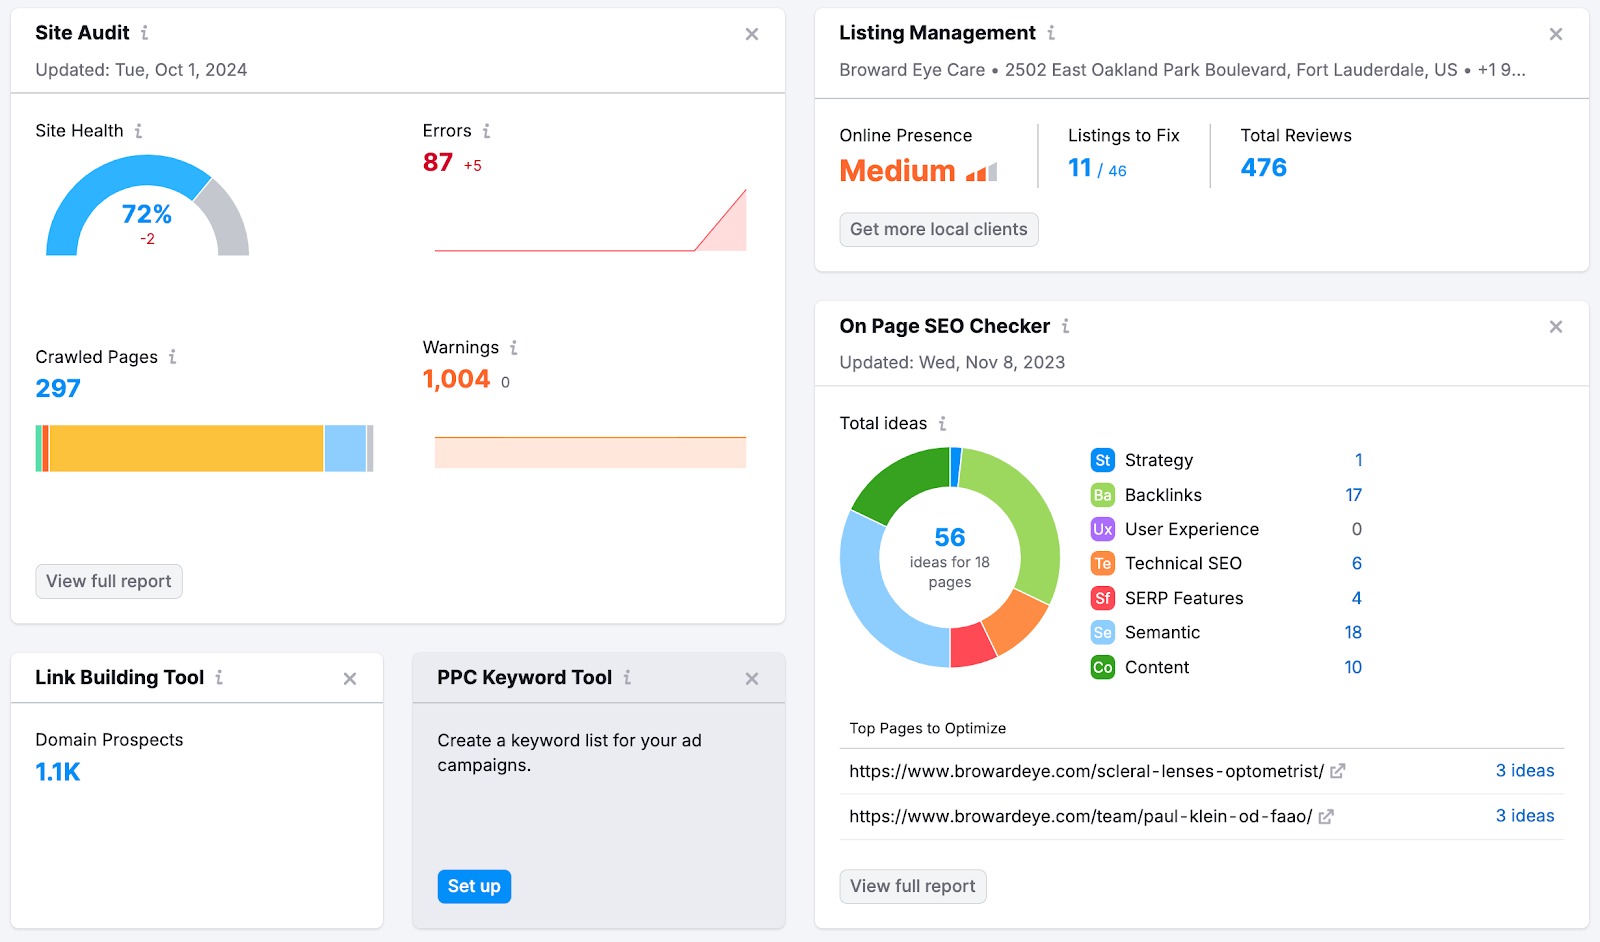
You can create a campaign straight from the SEO Dashboard by clicking the ‘Set Up’ button on the corresponding widget.
Traffic Data
To view traffic data about your site from the SEO Dashboard, you can connect your Google Analytics or use Semrush Data.
Semrush’s traffic data estimates your rivals’ domains’ traffic and visitor behavior. These are essential for benchmarking, identifying your competitors’ strengths and weaknesses, and refining your own marketing strategies.
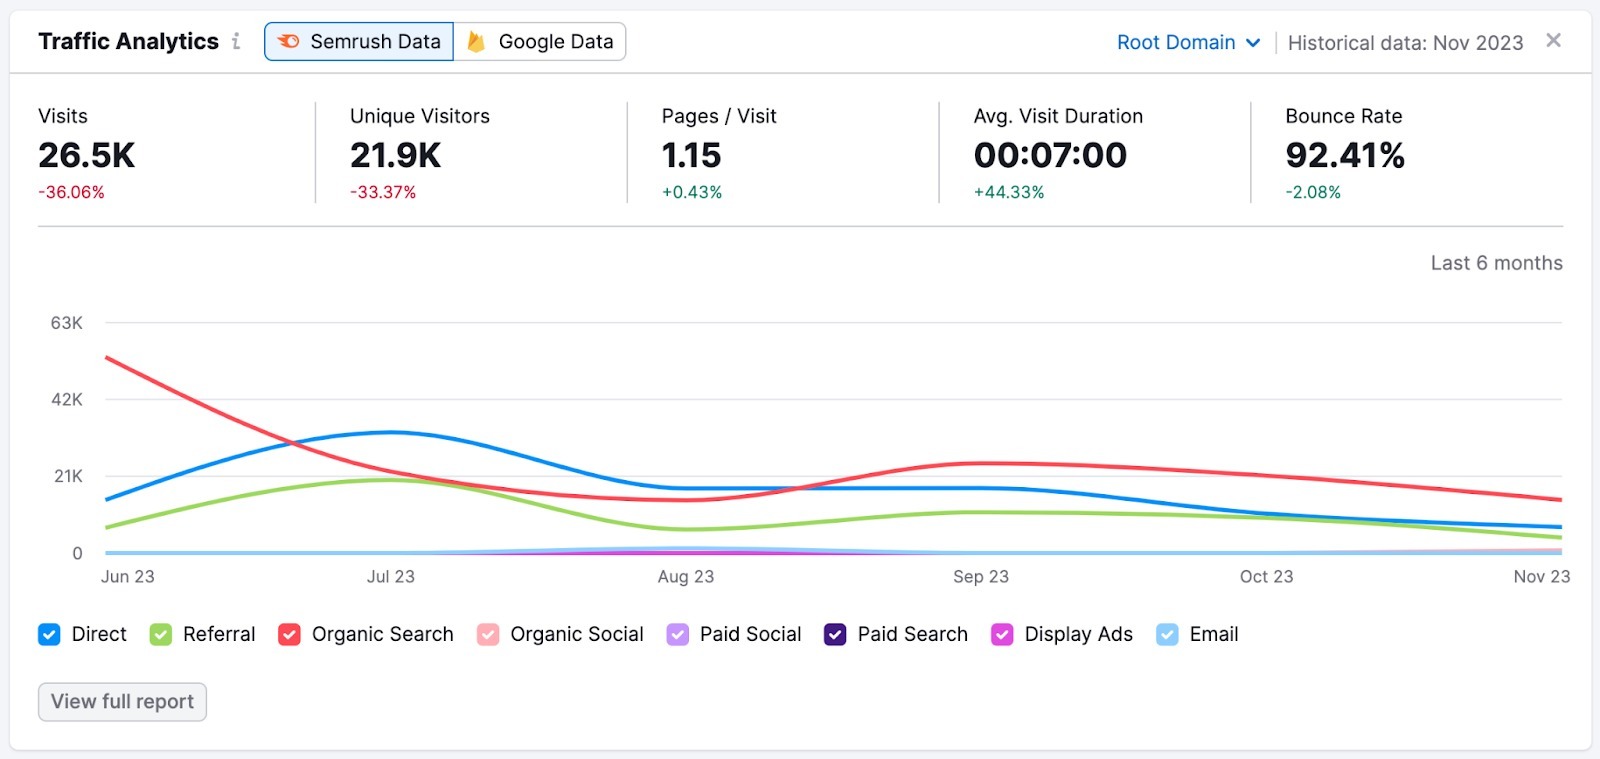
Traffic Analytics gathers information about tens of millions of visits daily, but it still can’t embrace the whole Web. If you’re a smaller site, there’s a chance that the data won’t be enough to display precise statistics.
Google Analytics
For your convenience, we’ve added a possibility to switch between Traffic Analytics and Google Analytics reports. If you are interested in collecting the most recent and precise data, you can connect Google Analytics to the SEO Dashboard.
To connect your Google Analytics account, navigate to the gear icon in the top right of the dashboard. Once there, you can choose which Google Account you wish to connect (works with GA4 properties).
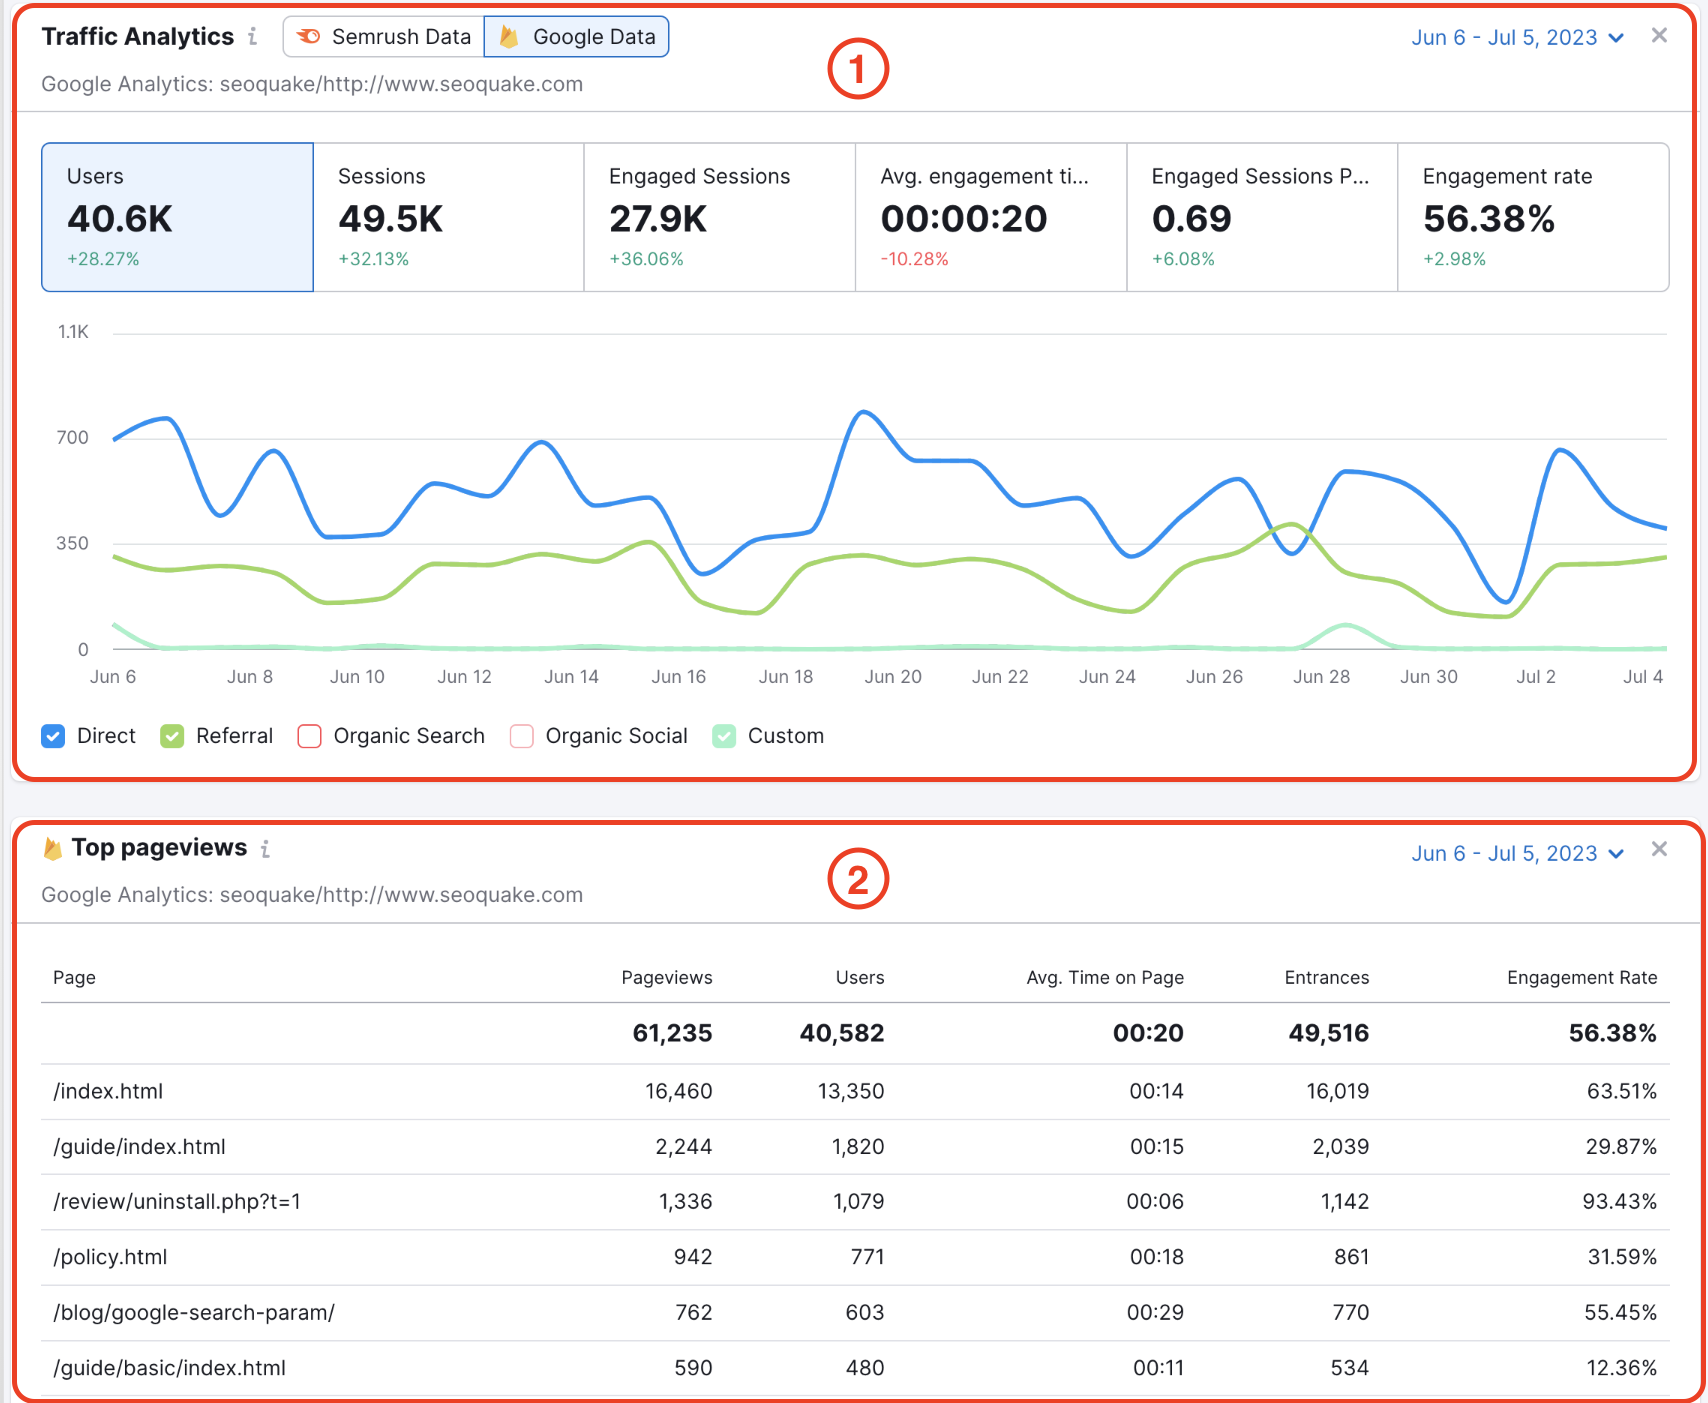
Additionally, you will be able to track even more data, including charts for the following:
- Google Analytics Metrics (users, sessions, engagement rate, etc)
- Top page views
See below how the Metrics charts (1) bring you a visual depiction of your GA metrics. The top pageviews widget (2) shows the pages bringing you the highest percentage of views.
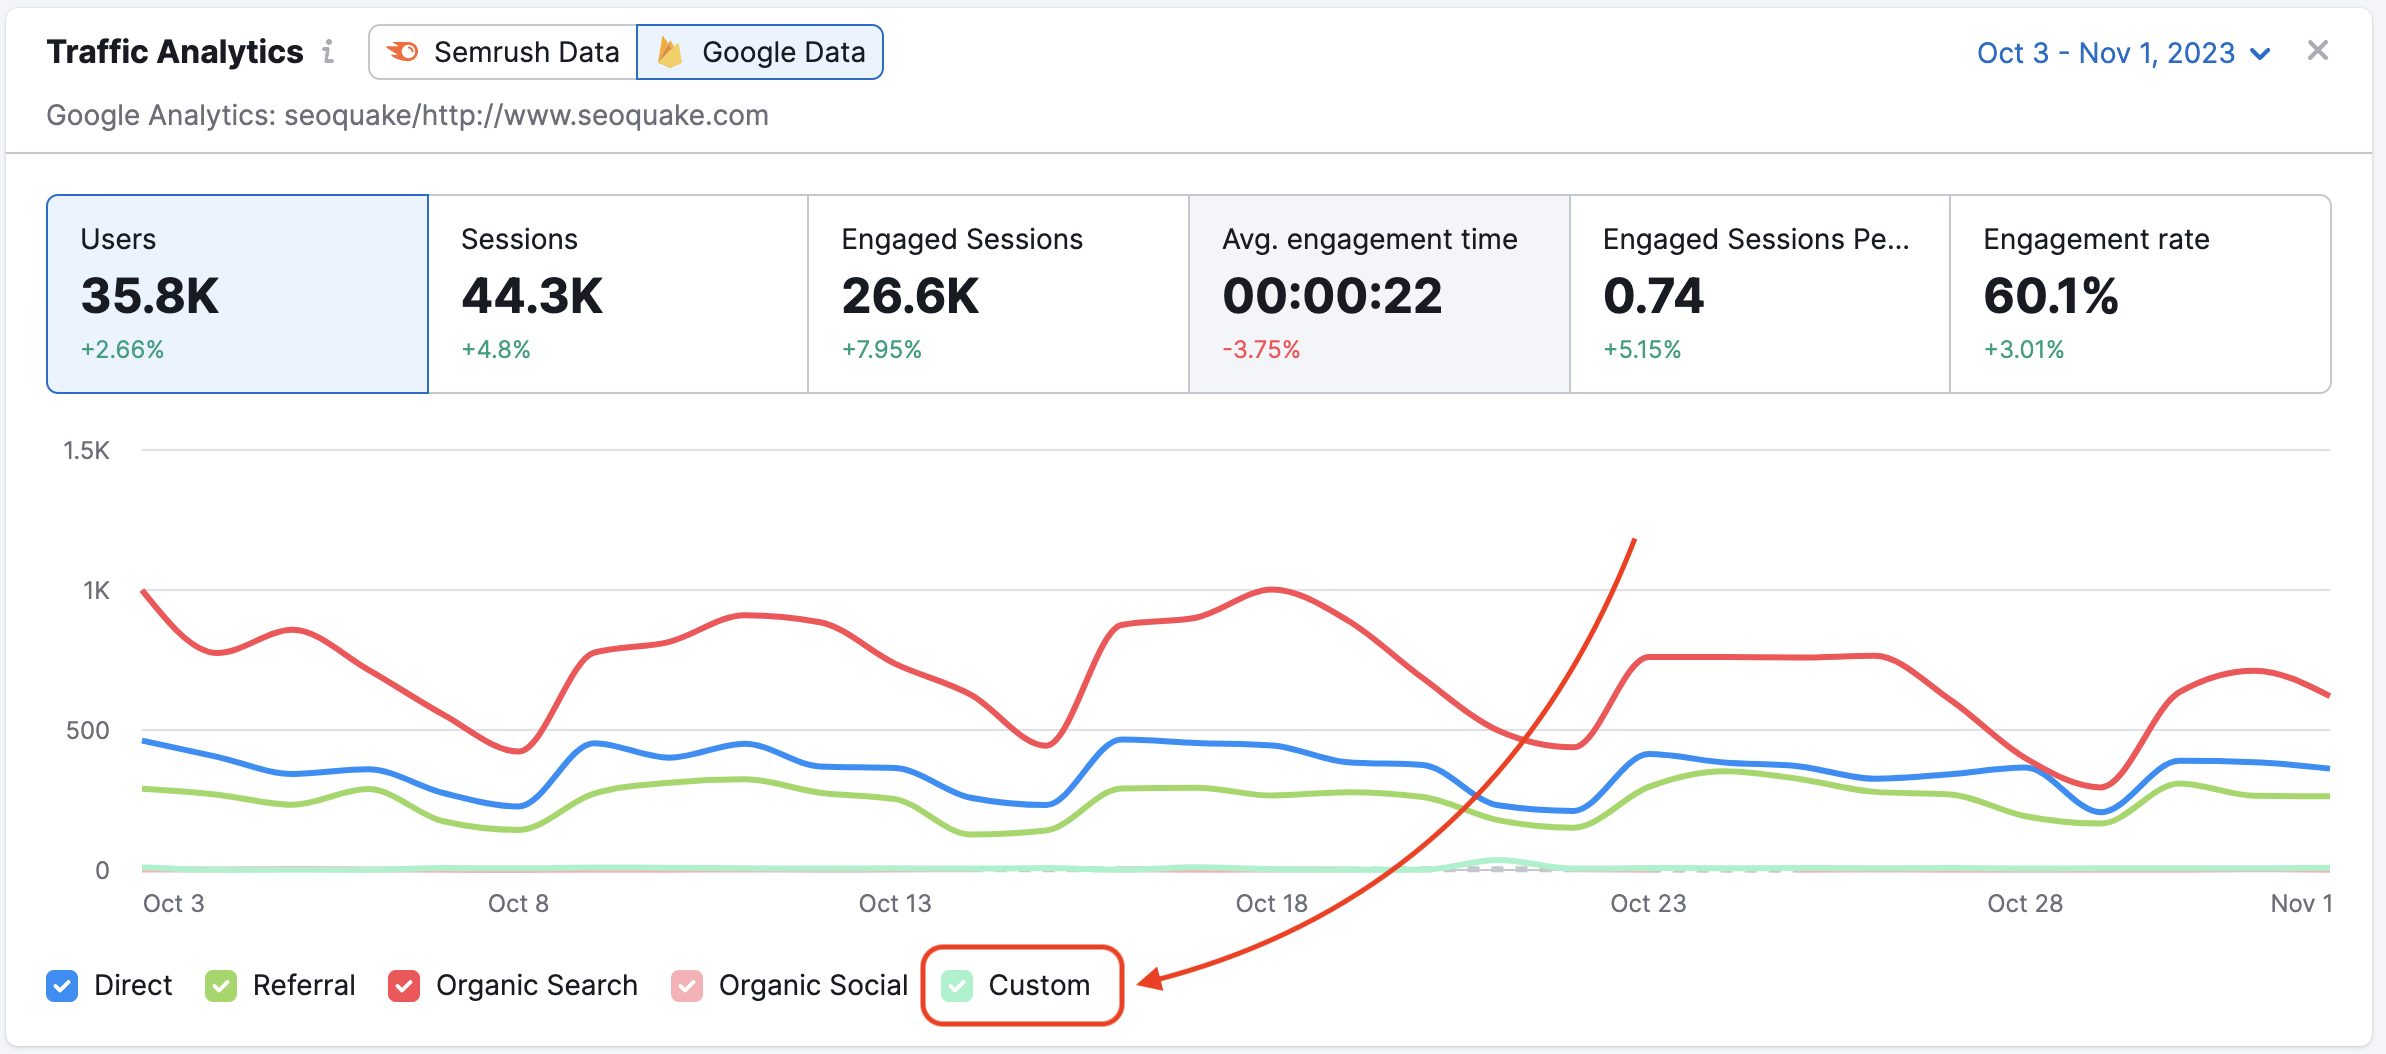
If you have configured a custom channel group in GA, we will display it in the trend in the Google Analytics report.
Google Search Console
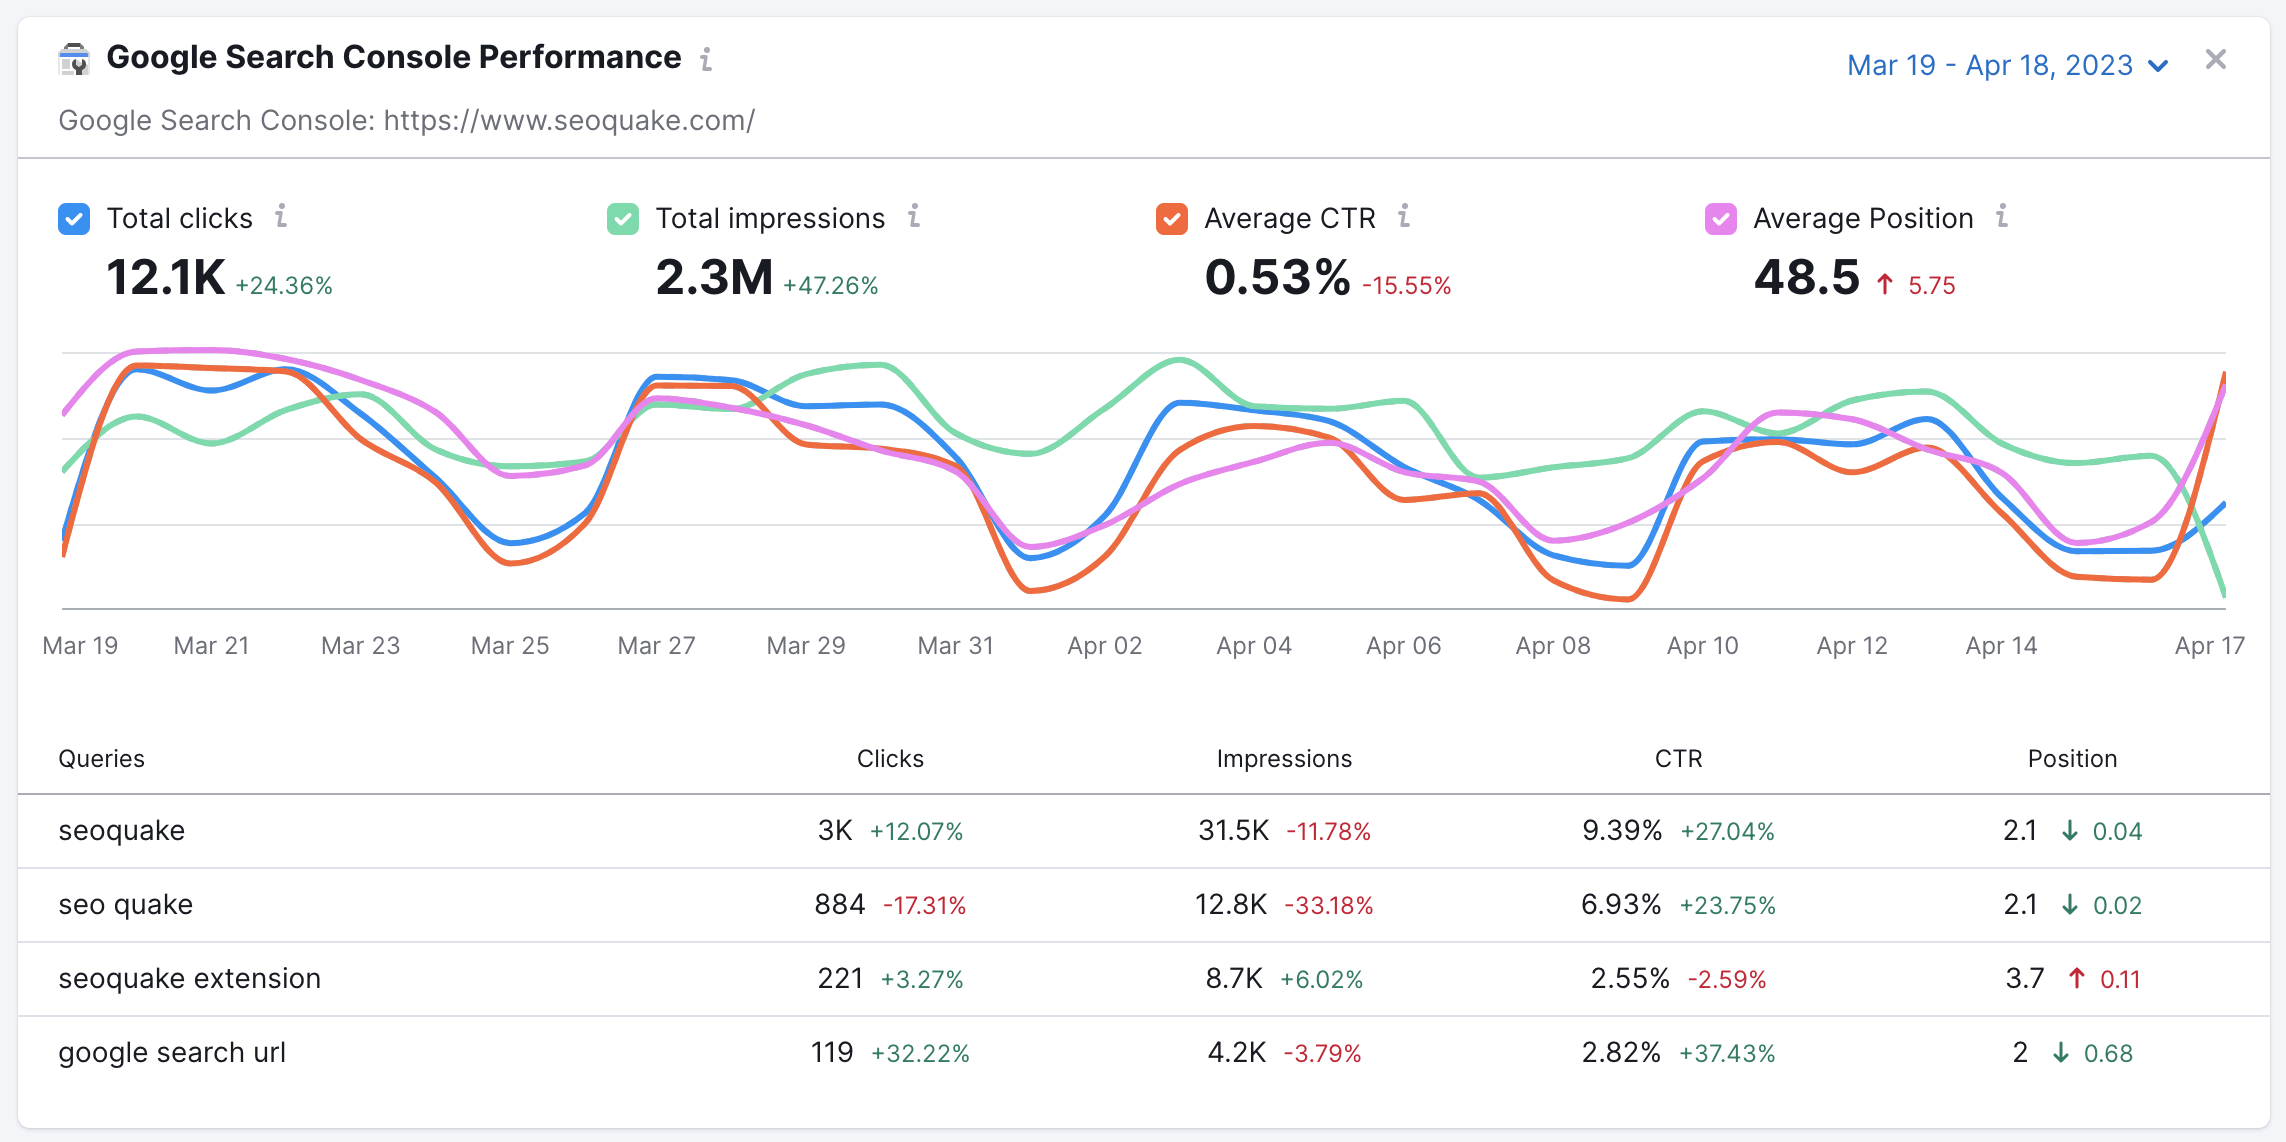
The SEO Dashboard also has the ability to integrate with your Google Search Console account. This will give you even more data regarding a search query. This includes total clicks, total impressions, average CTR, and average position.
Once connected with GSC, your SEO Dashboard will produce an interactive graph that allows you to view any of the aforementioned data sets.
Organic Research
The Organic Research widget shows organic traffic for the last month and keyword position changes trend with improved and declined keywords that caused traffic changes for the analyzed domain.
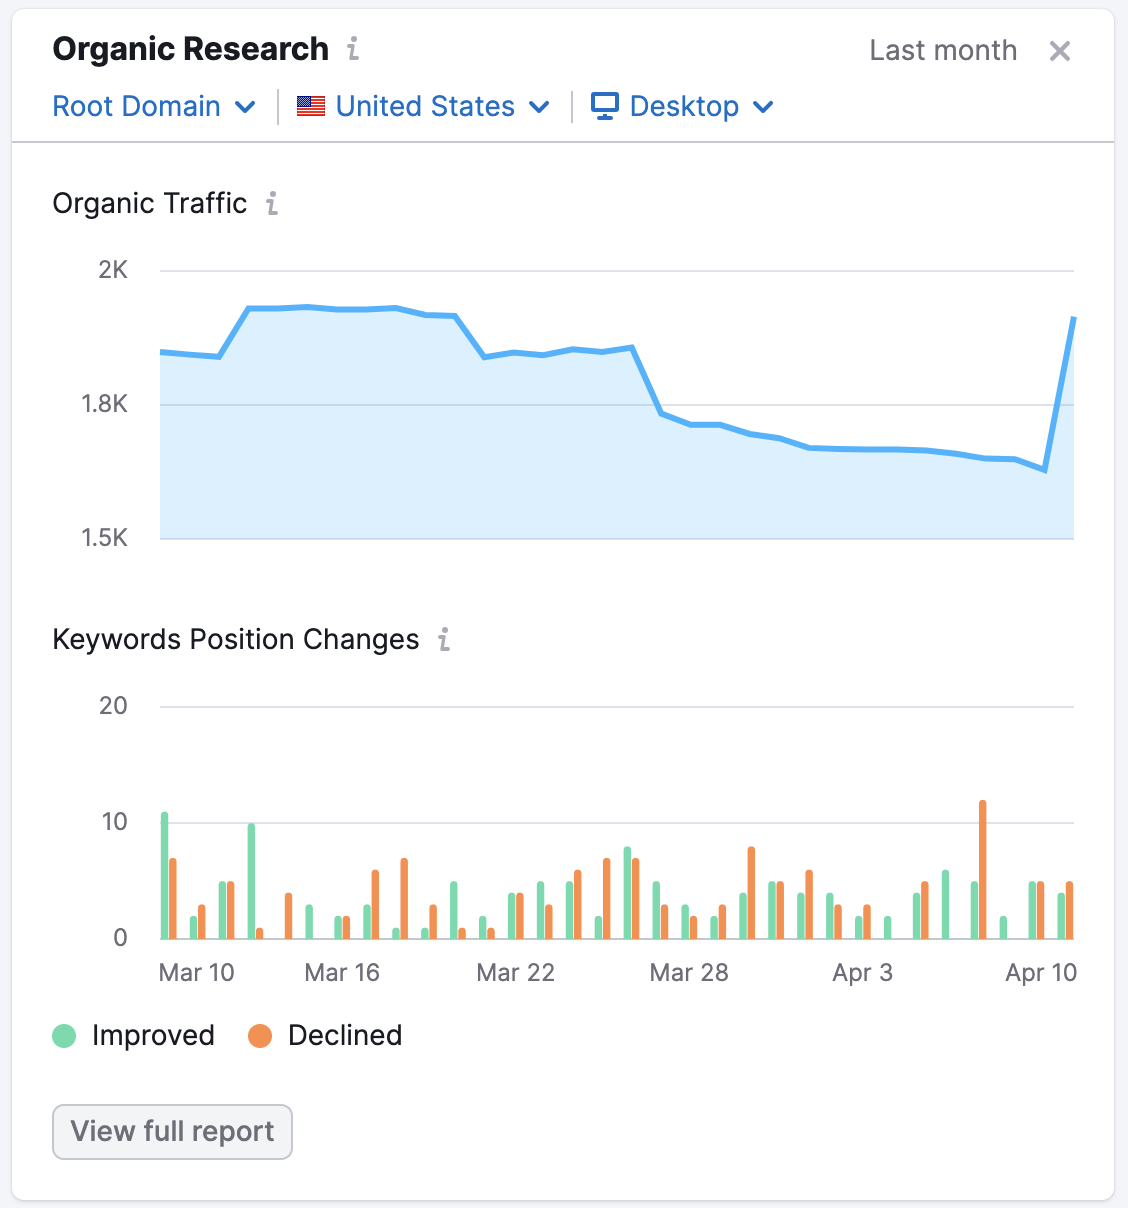
By clicking the “View full report” button you will be brought to the Position Changes report in the Organic Research tool.
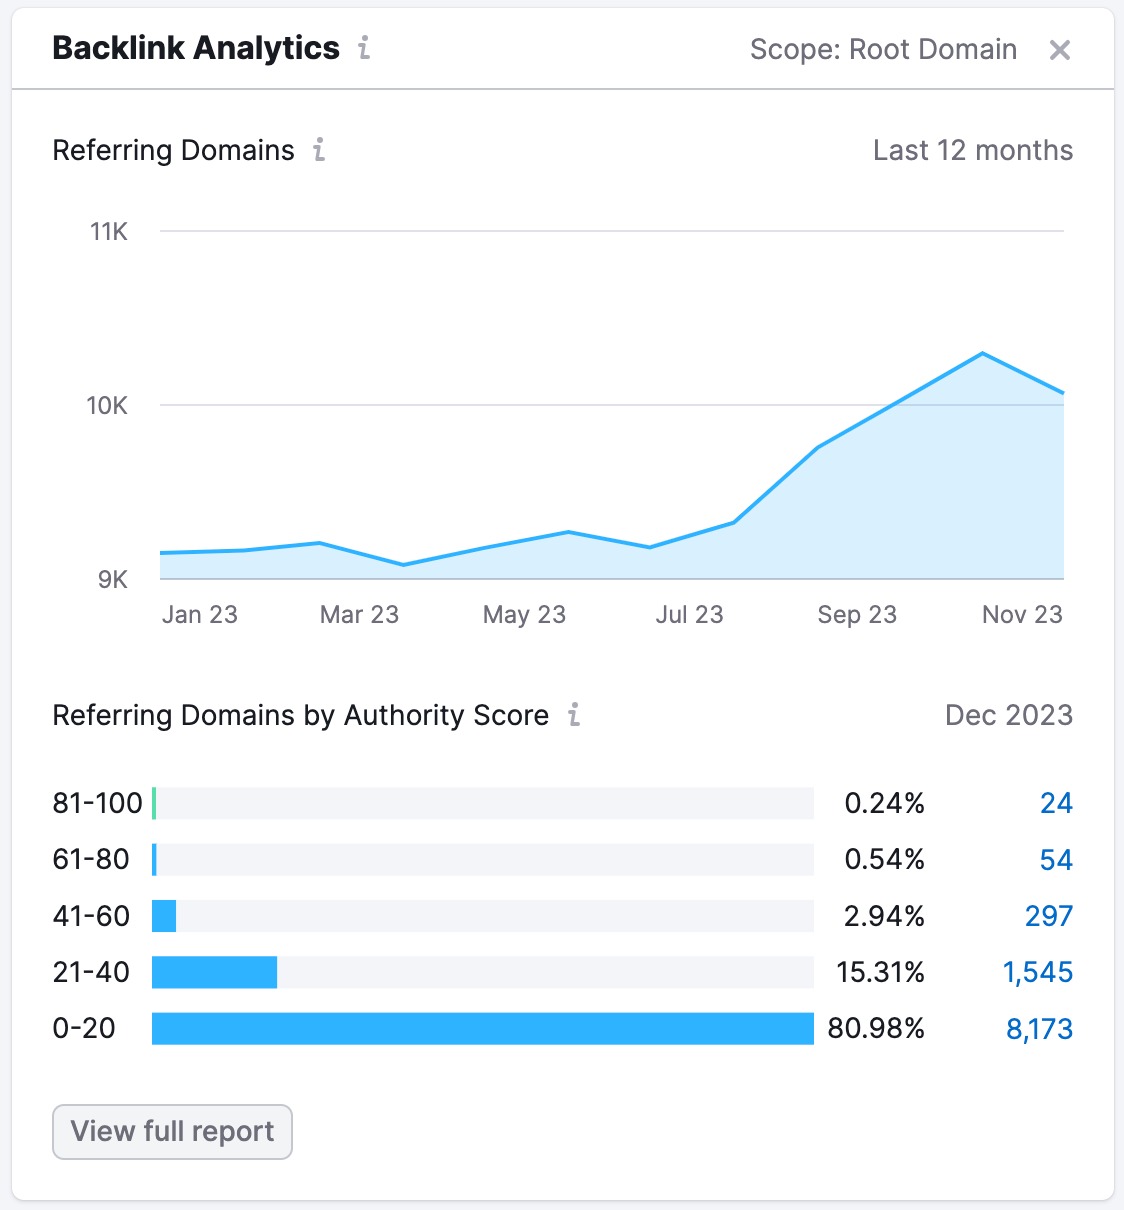
Backlink Analytics
The Backlink Analytics widget displays the trend of referring domains linking to an analyzed domain and the distribution of referring domains by Authority Score for the current date.